


 FxWirePro: AUD/USD edges lower, but bullish outlook persists
  FxWirePro- Major Crypto levels and bias summary
  FxWirePro: USD/JPY uptrend loses steam, remains on bullish path
  Crypto Major Pair Action Bias: ETHUSD Bullish as BTCUSD, SOLUSD & XRPUSD Stay Neutral
  ETH Stands Alone Bullish; BTC, SOL, XRP, BNB Neutral
  Gold Loses Steam After Strong U.S. Retail Sales
  FxWirePro- Major Crypto levels and bias summary
  FxWirePro:EUR/NZD dips below lower range, bearish bias increases
  FxWirePro: AUD/USD remains buoyant, looks to extend gains


 - EconoTimes)


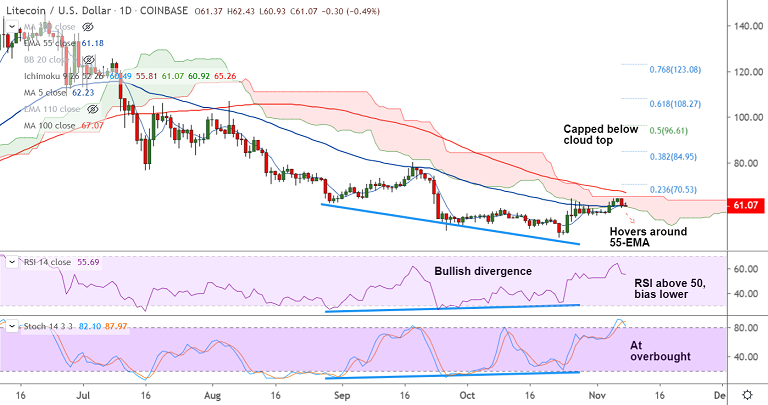
LTC/USD chart - Trading View
Exchange - Coinbase
Support: 57.91 (50-DMA); Resistance: 65.26 (cloud top)
Technical Analysis: Bias Neutral
After trading relatively bullish in the Asian hours, Litecoin has seen a sudden downside in the past 1 hour.
The pair has dipped 1.38% in the previous hour from highs at 62.17 to hourly low at 61.01.
Technical indicators have turned bearish on the hourly charts. Stochs and RSI support downside.
LTC/USD has managed to hold above 55-EMA support from the past 4 sessions. Weakness only on break below.
Stochastics indicator on the daily charts is at overbought with scope for rollover into neutral zone.
Next major support lies at 50-DMA at 57.91. Break below will see test of 50 levels.
On the flipside, breakout above daily cloud negates near-term bearishness.


