


 Crypto Major Pair Action Bias: ETHUSD Bullish as BTCUSD, SOLUSD & XRPUSD Stay Neutral
  FxWirePro- Major Crypto levels and bias summary
  FxWirePro- Woodies pivot (Major)
  FxWirePro: NZD/USD trades in narrow range ,outlook bullish
  ETHUSD Bullish Momentum: Follows BTC Above All EMAs, Buy Dips Near $1750 Targeting $2300
  FxWirePro:EUR/NZD dips below lower range, bearish bias increases
  FxWirePro :USD/JPY bulls loosen their grip a bit, dips to be bought


, break above required for further gains - EconoTimes)


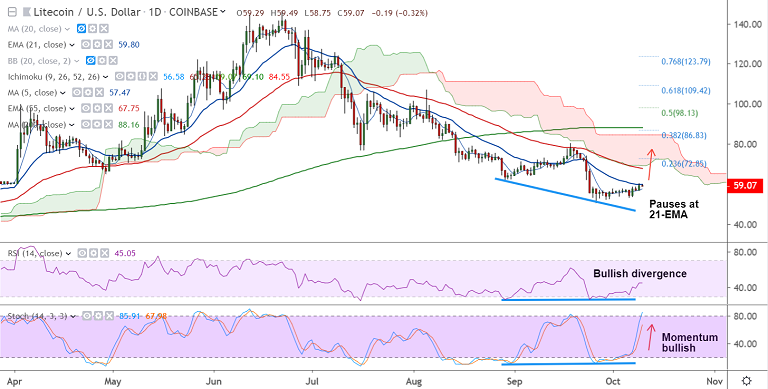
LTC/USD chart - Trading View
Exchange - Coinbase
Support: 57.47 (5-DMA); Resistance: 59.80 (21-EMA)
Technical Analysis: Bias slightly bullish
LTC/USD is trading largely rangebound on the day at 59.02 at 05:25 GMT, bias turning bullish.
The pair has paused upside at 21-EMA at 59.80, break above to fuel further gains.
Major trend remains bearish as shown by GMMA indicator, but momentum studies on the intraday charts are bullish.
MACD shows bullish crossover on signal line and Stochs are sharply higher.
Break above 21-EMA (59.80) will see test of 55-EMA at 67.74 ahead of 23.6% Fib at 72.85.
Rejection at 21-EMA and break below 5-DMA to see more weakness.


