


 FxWirePro: EUR/AUD outlook weaker on renewed downside pressure
  NZDJPY Bullish Surge: Strong Kiwi Ignites Fresh Upside as 94 Support Holds and All EMAs Align
  EUR/USD Holds Bullish Tone Despite Pullback from Yesterday’s High
  FxWirePro: GBP/NZD gains some upside momentum but still bearish
  FxWirePro- Woodies pivot (Major)
  FxWirePro: GBP/USD under pressure despite UK's modest economic growth
  FxWirePro: USD/JPY uptrend loses steam, remains on bullish path
  FxWirePro: NZD/USD trades in narrow range ,outlook bullish
  FxWirePro: GBP/USD hits one-month high, scope for further upside
  FxWirePro: USD/CAD falls after BoC rate hold and weak U.S. producer inflation
  FxWirePro- Major Pair levels and bias summary


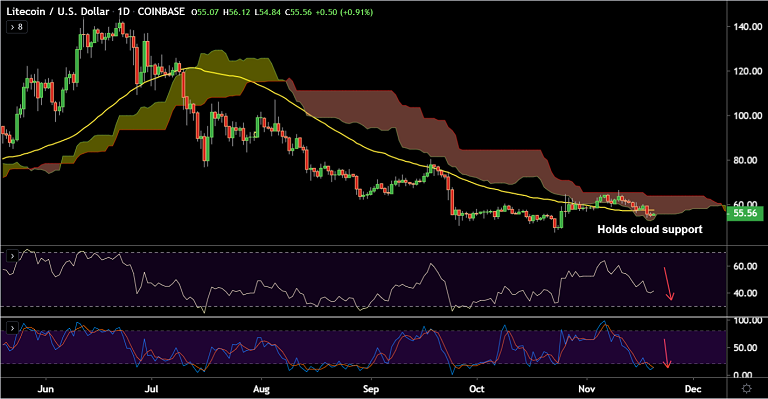
LTC/USD chart - Trading View
Exchange - Coinbase
Support: 53.36 (Cloud base); Resistance: 56.80 (5-DMA)
Technical Analysis: Bias Bearish
LTC/USD has paused 2 straight sessions of downside, more weakness on charts.
The pair was trading 1.34% higher at 55.80 at 07:10 GMT after closing 1.18% lower in the previous session.
Technical indicators are still largely bearish. Upside lacks traction. Series of strong resistances upto 59.78.
Price action is holding support at daily cloud (currently at 53.36). Breach below will see resumption of weakness.
Major supports on the downside lie at 50.25 (Sept 26 low), 47.22 (Oct 23 low) and 41.43 (Lower BB W).
5-DMA is immediate resistance at 56.77. Break above could see gains till 55-EMA at 60.34.


