


 FxWirePro: EUR/NZD eases after hot US CPI data
  FxWirePro: USD/ZAR bearish again as upside bias reverses
  EUR/USD Defies ECB Rate Hike to Reclaim 1.1600: Technical Setup Points to Buy-on-Dips Opportunity
  FxWirePro: USD/CAD firms slightly, but downward resumption looks likely
  Bitcoin Consolidates Near $78K: Will Strong ETF Inflows Trigger a Breakout to $90K?
  FxWirePro: EUR/NZD gaining momentum for a move towards 2.0100 level
  FxWirePro: GBP/AUD struggle to extend its recovery, good to sell on rally
  NZDJPY Consolidates, Resistance at 90.78 May Signal Favorability for Downtrend
  FxWirePro: GBP/NZD gains some upside momentum but still bearish


 Add as a preferred source on Google
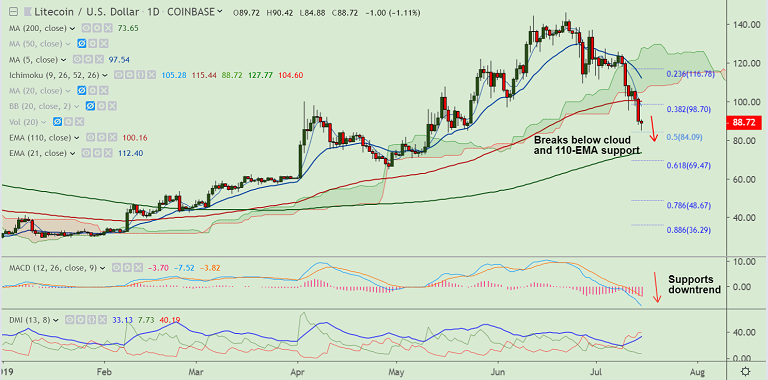
LTC/USD chart - Trading View
Exchange - Coinbase
Support: 84.09 (50% Fib); Resistance: 97.51 (5-DMA)
Technical Analysis: Bias Bearish
LTC/USD has edged higher from 8-week lows at 84.88, bias still bearish.
The pair is trading at 88.61 at 10:52 GMT, down 1.10% at the time of writing.
'Potential Hammer' formation on the daily charts keeps downside limited.
Technical studies support weakness. Break below 84 handle could see resumption of downside.
Immediate support lies at 55W EMA at 81.04. Next major support lies at 200-DMA at 73.65.
Breach at 200-DMA opens up major downside for the pair. Weakness till 48.67 then likely.
On the flipside, retrace above 110-EMA could dent downside. Upside resumption only above 20-DMA (115).
For details on FxWirePro's Currency Strength Index, visit http://www.fxwirepro.com/currencyindex.







