


 ETH Stands Alone Bullish; BTC, SOL, XRP, BNB Neutral
  Crypto Major Pair Action Bias: ETHUSD Bullish as BTCUSD, SOLUSD & XRPUSD Stay Neutral
  FxWirePro- Woodies pivot (Major)
  FxWirePro: USD/CAD falls after BoC rate hold and weak U.S. producer inflation
  FxWirePro- Major Crypto levels and bias summary
  AUDJPY Bullish Surge: Strong Australian Dollar Fuels Fresh Upside as Pair Holds Above 113.50 and All EMAs Align


, further weakness on break below - EconoTimes)


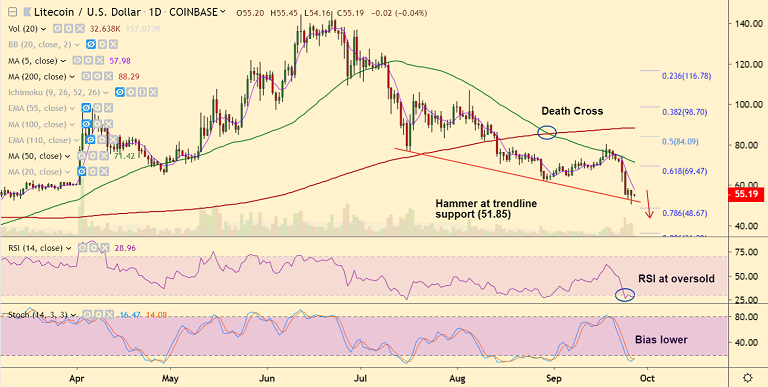
LTC/USD chart - Trading View
Exchange - Coinbase
Support: 51.85 (Trendline); Resistance: 57.91 (5-DMA)
Technical Analysis: Bias Bearish
Litecoin trades in narrow range, was trading 0.69% lower on the day at 54.83 at 07:00 GMT.
The pair hit 6-month lows at 50.25 on Thursday's trade, before paring losses to close at 55.21.
Major trend is bearish, recovery attempts lack traction. 'Death Cross' limits upside.
On the other side, oscillators are at oversold levels and 'hammer' formation on the daily charts (Thursday) raises scope for upside.
Bullish divergence (RSI and Stochs) on the hourly charts has pushed price above 21H EMA.
Next hurdle lies at 5-DMA at 58.01. Break above will see further upside. On the other side, break below trendline support (51.85) will see resumption of weakness.


