


 FxWirePro: GBP/USD rises as soft US data pressures dollar
  FxWirePro:USD/JPY climbs back above 160.00 after BOJ rate decision
  FxWirePro: AUD/USD gains some ground but outlook is bearish
  FxWirePro: NZD/USD consolidates overnight gains, but loses momentum
  US Magnificent 7 Stocks Trend Score: Amazon & Microsoft Hit Extreme Bullish (+100) as Meta Drops to -100 — Key Resistance & Support Watchlist
  Nikkei Surges Past 65,000 on Suspected Yen Weakness: Tech Giants Like Advantest and NEC Lead Explosive Gains
  NZDJPY Bullish Rebound: Buy Dips as EMAs Align for 97 Target
  FxWirePro: USD/ZAR gains as stronger dollar outweighs upbeat South Africa's trade surplus
  FxWirePro: USD/CAD retreats after Canada posts stronger-than-expected GDP growth


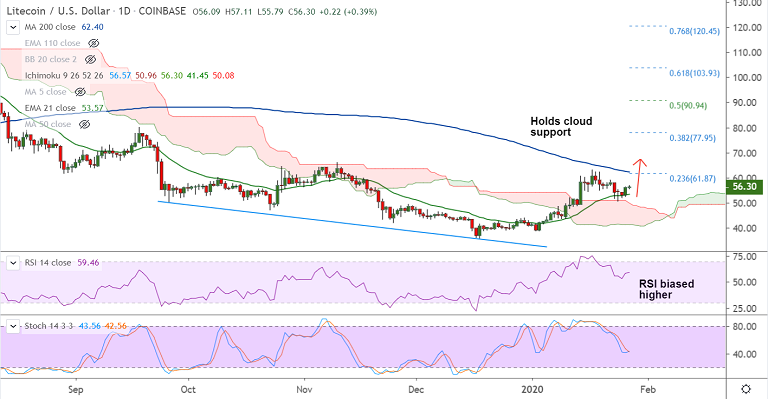
LTC/USD chart - Trading View
Exchange - Coinbase
Technical Analysis: Bias Neutral
GMMA Indicator: Major Trend - Bullish; Minor Trend - Turning slightly bullish
Overbought/ Oversold Index: Neutral
Volatility: High
Support: 54.88 (5-DMA); Resistance: 62.40 (200-DMA)
LTC/USD was trading largely muted on the day at 56.34 at around 09:35 GMT.
The pair is struggling to extend previous session's rally, finds stiff resistance at 55W EMA at 56.74.
Price action has bounced off daily cloud support and has retraced above 200H MA.
Major and minor trend as evidenced by GMMA indicator are biased higher. Scope for upside.
The pair finds strong resistance at 21W EMA at 56.72. Break above will see gains till 200-DMA at 62.40.
200-DMA breakout will support a sustained upside.Next bull target aligns at 38.2% Fib at 77.95.
21-EMA is strong support at 53.55. Break below negates near-term upside bias.







