


 FxWirePro: USD/JPY uptrend loses steam, remains on bullish path
  EUR/USD Holds Bullish Tone Despite Pullback from Yesterday’s High
  ETH Stands Alone Bullish; BTC, SOL, XRP, BNB Neutral
  FxWirePro: USD/CAD falls after BoC rate hold and weak U.S. producer inflation
  FxWirePro: GBP/USD hits one-month high, scope for further upside
  FxWirePro: NZD/USD steadies around 0.5830,retains bid tone
  ETHUSD Bullish Momentum: Follows BTC Above All EMAs, Buy Dips Near $1750 Targeting $2300
  FxWirePro- Woodies pivot (Major)
  GBPJPY Bullish Surge: Strong Pound Ignites Fresh Upside on Fed-BOE Policy Divergence as All EMAs Align


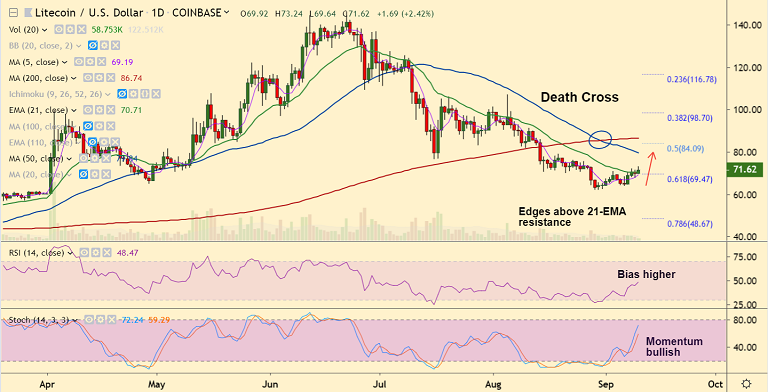
LTC/USD chart - Trading View
Exchange - Coinbase
Support: 69.28 (5-DMA); Resistance: 73.80 (4H 200 SMA)
Technical Analysis: Intraday bias bullish
Litecoin is trading 2.95% higher on the day at 71.98 at 04:00 GMT, intraday bias is bullish.
Stochs and RSI are biased higher and 'bullish divergence' on Stochs adds to the bullish bias.
LTC/USD has edged above 200H SMA and is trading above cloud and major EMAs on the hourly chart.
Major trend is bearish, however, the pair has edged above 21-EMA raising scope for upside.
4H 200 SMA is strong resistance at 73.80, breakout above will confirm further gains.
Break above 4H 200 SMA (73.80) eyes 50-DMA at 79.84 ahead of 200-DMA at 86.74.
'Death Cross' could limit gains. 200-DMA breakout negates bearish bias.


