


 NZDJPY Bullish Surge: Strong Kiwi Ignites Fresh Upside as 94 Support Holds and All EMAs Align
  EUR/USD Holds Bullish Tone Despite Pullback from Yesterday’s High
  FxWirePro: GBP/NZD downtrend loses steam, remains on bearish path
  FxWirePro- Major Crypto levels and bias summary
  FxWirePro: USD/CAD falls after BoC rate hold and weak U.S. producer inflation
  Major Pair Action Bias: Extremely Bullish Surge Powers GBPUSD & NZDUSD as Bullish Momentum Ignites
  JPY Action Bias: Extremely Bullish Surge Ignites Across NZD, GBP & AUD
  ETH Stands Alone Bullish; BTC, SOL, XRP, BNB Neutral
  FxWirePro- Major Crypto levels and bias summary
  Crypto Major Pair Action Bias: ETHUSD Bullish as BTCUSD, SOLUSD & XRPUSD Stay Neutral
  FxWirePro- Major Pair levels and bias summary


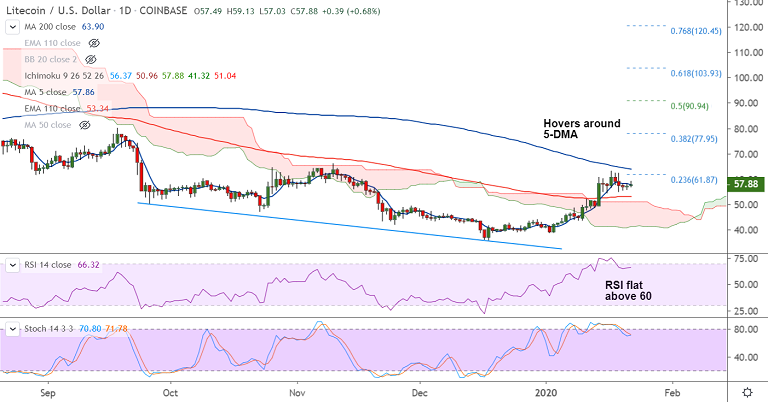
LTC/USD chart - Trading View
Exchange - Coinbase
Technical Analysis: Bias Bullish
GMMA Indicator: Major Trend - Bullish; Minor Trend - Bullish
Overbought/ Oversold Index: Neural
Volatility: Shrinking
Support: 52.71 (21-EMA); Resistance: 63.90 (200-DMA)
LTC/USD was trading 1.03% higher at 58.08 at around 09:50 GMT, bias is bullish.
The pair has retraced brief dip below 200H MA, scope for upside resumption.
Price action holds above daily cloud and correction has paused above 110-EMA.
Momentum studies are bullish. Stochs and RSI have again turned bullish after minor correction from overbought levels.
Major and minor trend as evidenced by GMMA indicator are bullish and resumption of upside will see test of 200-DMA at 63.90.
110-EMA is strong support at 53.34. Breach below cloud will see bullish invalidation.


