


 ETHUSD Bullish Momentum: Follows BTC Above All EMAs, Buy Dips Near $1750 Targeting $2300
  FxWirePro- Woodies pivot (Major)
  ETH Stands Alone Bullish; BTC, SOL, XRP, BNB Neutral
  FxWirePro- Major Crypto levels and bias summary
  FxWirePro: GBP/NZD gains some upside momentum but still bearish
  FxWirePro: USD/CAD falls after BoC rate hold and weak U.S. producer inflation
  EUR/USD Holds Bullish Tone Despite Pullback from Yesterday’s High
  FxWirePro- Woodies pivot (Major)
  FxWirePro :USD/JPY bulls loosen their grip a bit, dips to be bought


 - EconoTimes)


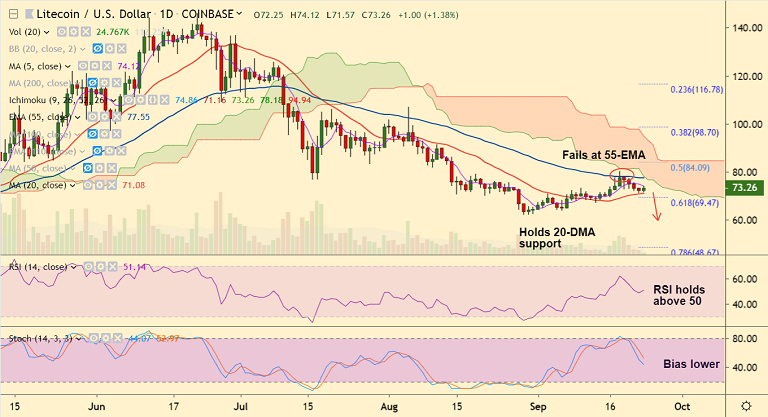
LTC/USD chart - Trading View
Exchange - Coinbase
Support: 71.08 (20-DMA); Resistance: 77.55 (55-EMA)
Technical Analysis: Bias Bearish
LTC/USD fails to break above 55-EMA, slips lower from 5-week highs at 80.26.
The pair has on the day stalled downside after 4 straight sessions of weakness.
Price was marginally higher at the time of writing, at 73.23, up 1.34% at 10:30 GMT.
Major trend in the pair has been bearish and rejection at 55-EMA has reinforced downside.
Price action currently finds support at 20-DMA at 71.08. Break below will see extension of weakness.
Bullish divergence could limit downside. Dip till 62.05 (Aug 29 low) likely. Further weakness will see downside till 48.67 (78.6% Fib).
On the flipside, breakout at 55-EMA and into daily cloud will negate near-term bearishness.


