


 JPY Action Bias: Extremely Bullish Surge Ignites Across NZD, GBP & AUD
  EUR/USD Holds Bullish Tone Despite Pullback from Yesterday’s High
  FxWirePro- Major Pair levels and bias summary
  FxWirePro: AUD/USD edges lower, but bullish outlook persists
  GBPUSD, AUDUSD & NZDUSD Turn Extremely Bullish: Strong Positive Momentum Drives Major Pair Action Bias
  FxWirePro: NZD/USD trades in narrow range ,outlook bullish
  FxWirePro- Major Crypto levels and bias summary
  FxWirePro- Major Crypto levels and bias summary


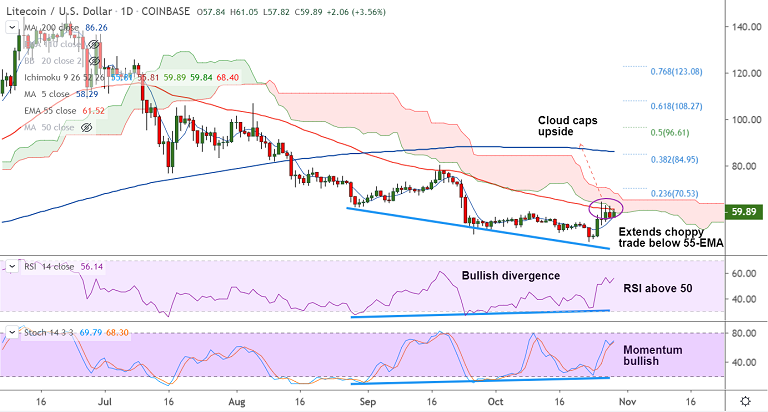
LTC/USD chart - Trading View
Exchange - Coinbase
Support: 56.32 (21-EMA); Resistance: 61.52 (55-EMA)
Technical Analysis: Turning slightly bullish
Litecoin is extending choppy trade below 55-EMA resistance (currently at 61.52).
The pair has bounced off major trendline support and breakout at 55-EMA will see upside continuation.
Volatility is rising as evidenced by expanding Bollinger bands. Technical indicators support gains.
Stochs and RSI are biased higher and 'Bullish Divergence' adds to the upside bias.
GMMA indicator shows major trend remains bearish. But, there is a shift in near-term trend to bullish.
Break above 55-EMA and cloud finds next major hurdle at 23.6% Fib at 70.53. Further bullishness could see test of 200-DMA at 86.26.
21-EMA at 56.32 is strong support. Retrace below will see downside resumption.


