


 NZDJPY Bullish Surge: Strong Kiwi Ignites Fresh Upside as 94 Support Holds and All EMAs Align
  Crypto Major Pair Action Bias: ETHUSD Bullish as BTCUSD, SOLUSD & XRPUSD Stay Neutral
  FxWirePro- Major Pair levels and bias summary
  AUDJPY Bullish Surge: Strong Australian Dollar Fuels Fresh Upside as Pair Holds Above 113.50 and All EMAs Align
  FxWirePro- Major Crypto levels and bias summary
  GBPJPY Bullish Surge: Strong Pound Ignites Fresh Upside on Fed-BOE Policy Divergence as All EMAs Align
  FxWirePro: GBP/USD under pressure despite UK's modest economic growth
  FxWirePro- Major Crypto levels and bias summary
  EUR/USD Holds Bullish Tone Despite Pullback from Yesterday’s High
  FxWirePro- Major Crypto levels and bias summary
  FxWirePro: USD/JPY uptrend loses steam, remains on bullish path
  GBPUSD, AUDUSD & NZDUSD Turn Extremely Bullish: Strong Positive Momentum Drives Major Pair Action Bias


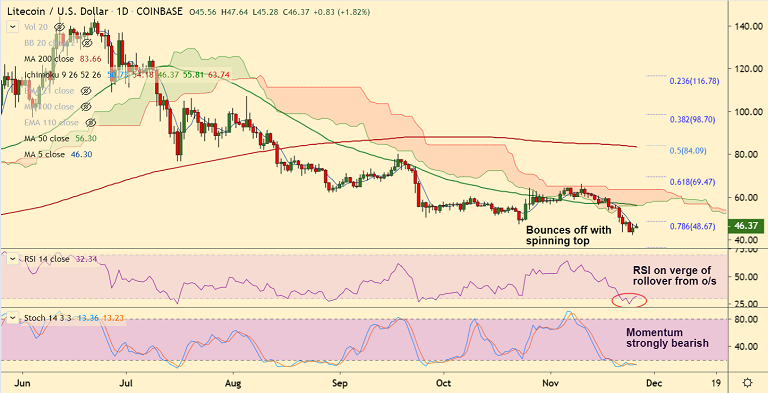
LTC/USD chart - Trading View
Exchange - Coinbase
Support: 45.65 (50H MA); Resistance: 47.64 (110H EMA)
Technical Analysis: Bias slightly bullish
LTC/USD edges lower from session highs 47.64, intraday bias neutral to slightly bullish.
The pair is extending upside for the 2nd straight session, was trading at 46.33, up 1.73% at 07:30 GMT.
Price action has edged higher from multi-month lows at 45.28, hovers around 5-DMA at 46.33.
Technical indicators are turning slightly bullish on the intraday charts, but major trend remains bearish.
Price has edged above hourly cloud and 'Bullish Divergence' on RSI on the hourly charts keeps scope for further gains.
200H MA at 50.80 is next immediate hurdle on the upside. Break above will see gains upto 21-EMA at 53.38.


