


 FxWirePro: NZD/USD steadies around 0.5830,retains bid tone
  FxWirePro: AUD/USD remains buoyant, looks to extend gains
  JPY Action Bias: Extremely Bullish Surge Ignites Across NZD, GBP & AUD
  FxWirePro: GBP/NZD gains some upside momentum but still bearish
  ETHUSD Bullish Momentum: Follows BTC Above All EMAs, Buy Dips Near $1750 Targeting $2300
  AUDJPY Bullish Surge: Strong Australian Dollar Fuels Fresh Upside as Pair Holds Above 113.50 and All EMAs Align
  FxWirePro- Major Crypto levels and bias summary


 - EconoTimes)


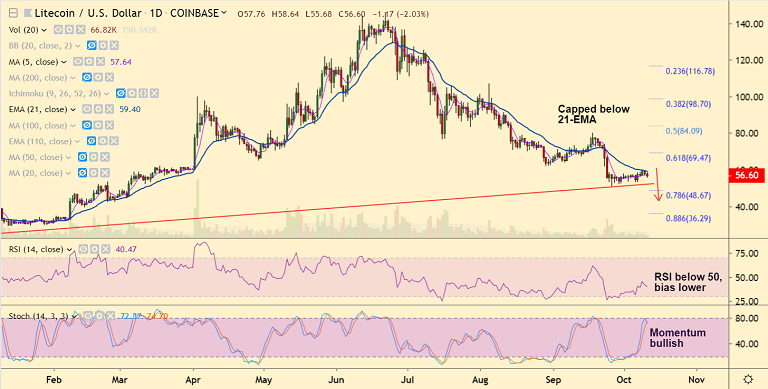
LTC/USD chart - Trading View
Exchange - Coinbase
Support: 51.50 (trendline); Resistance: 59.39 (21-EMA)
Technical Analysis: Bias bearish
LTC/USD capped below 21-EMA, extends weakness for the 2nd straight session.
The pair has slipped below 5-DMA and is holding support at 2H 200 SMA at 56.20.
Price action has slipped below 200H SMA (56.82), technical indicators on the intraday charts are turning bearish.
RSI on the daily charts is below 50 and biased lower. 'Bearish divergence' on the hourly charts adds to the bearish bias.
Break below 2H 200 SMA will see drag till major trendline support at 51.50. Violation there could see test of 78.6% Fib at 48.67.
5-DMA is immediate resistance at 57.61. Breakout above 21-EMA (59.38) negates bearish bias.


