


 FxWirePro: AUD/USD edges lower, but bullish outlook persists
  FxWirePro- Major Crypto levels and bias summary
  GBPUSD, AUDUSD & NZDUSD Turn Extremely Bullish: Strong Positive Momentum Drives Major Pair Action Bias
  FxWirePro- Woodies pivot (Major)
  FxWirePro: GBP/NZD gains some upside momentum but still bearish
  FxWirePro- Major Crypto levels and bias summary
  Major Pair Action Bias: Extremely Bullish Surge Powers GBPUSD & NZDUSD as Bullish Momentum Ignites
  JPY Action Bias: Extremely Bullish Surge Ignites Across NZD, GBP & AUD
  FxWirePro: NZD/USD trades in narrow range ,outlook bullish
  NZDJPY Bullish Surge: Strong Kiwi Ignites Fresh Upside as 94 Support Holds and All EMAs Align


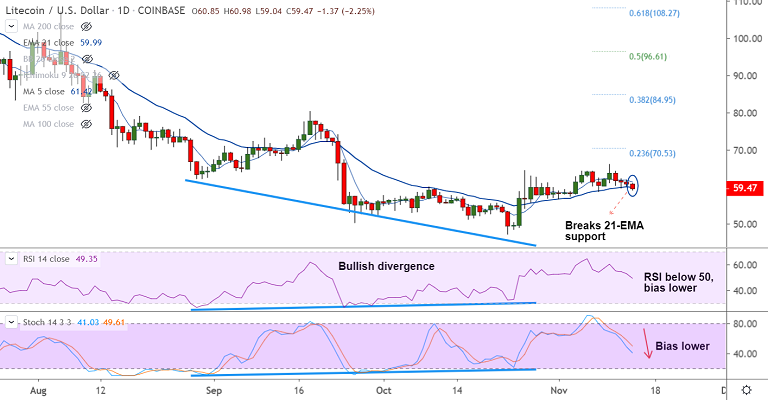
LTC/USD chart - Trading View
Exchange - Coinbase
Support: 57.28 (50-DMA); Resistance: 61.22 (55-EMA)
Technical Analysis: Bias bearish
LTC/USD was trading 2.04% lower on the day at 59.57 at 04:50 GMT, slightly above session lows at 59.04.
The pair has broken below 21-EMA support at 60.00 raising scope for further downside.
Technical indicators support weakness. Stochs and RSI are sharply lower and RSI has slipped below the 50 mark.
MACD is on verge of a bearish crossover on signal line.
Immediate support lies at 5W SMA at 59.29. Dip till 50-DMA at 57.28 likely. 'Bullish Divergence' may limit downside.
On the flipside, 55-EMA is major resistance at 61.22. Break above finds next resistance at 100-DMA at 65.05.


