


 FxWirePro- Major Crypto levels and bias summary
  NZDJPY Consolidates, Resistance at 90.78 May Signal Favorability for Downtrend
  EURUSD Holds Above 1.1600 Despite US CPI, Fed Rate Hike on the Horizon
  FxWirePro- Major Pair levels and bias summary
  FxWirePro: USD/ZAR bearish again as upside bias reverses
  Gold Loses Luster Amid Rising US Bond Yields, Iran Conflict; Sell on Rallies Advised
  FxWirePro: AUD/USD stays defensive ahead of key U.S. inflation data
  Major Currency Pair Scores: USD/CHF Signals Strong Bullish Momentum as NZD/USD Turns Heavily Bearish
  FxWirePro: EUR/NZD gaining momentum for a move towards 2.0100 level
  FxWirePro: USD/JPY slips as yen firms after hot Japan's wholesale inflation data
  FxWirePro: EUR/AUD scales one-week peak after ECB rate hike
  FxWirePro- Major Crypto levels and bias summary


 Add as a preferred source on Google
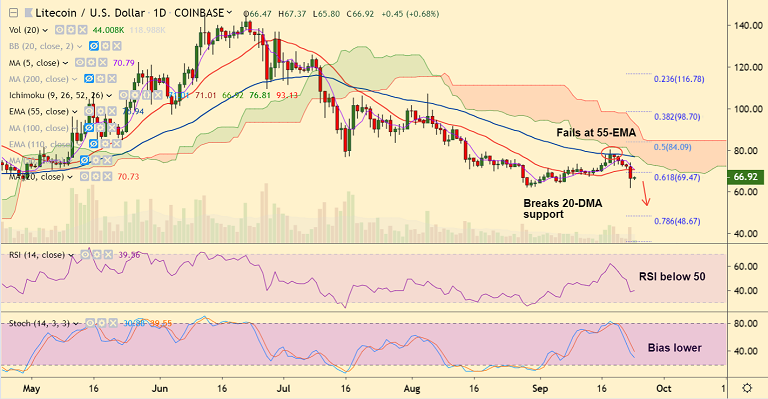
LTC/USD chart - Trading View
Exchange - Coinbase
Support: 56.80 (Mar 20 low); Resistance: 70.73 (20-DMA)
Technical Analysis: Bias Bearish
LTC/USD consolidates previous session's losses, bias remains bearish.
The pair has shown a break below 20-DMA support on Monday's trade.
Price hit 5-month lows at 61.75 before paring some losses to close at 66.47.
'Death Cross' weighs on the upside. Recovery capped at 55-EMA.
Technical indicators support further downside in the pair. Stochs and RSI sharply lower.
MACD on verge of bearish crossover on signal line and ADX support for downtrend seen.
Next major supports align at 56.80 (Mar 20 low), 52.15 (Mar 12 low) and 48.67 (78.6% Fib).
20-DMA is strong resistance at 70.73. Breakout above 55-EMA required for bearish invalidation.







