


 FxWirePro- Major Crypto levels and bias summary
  FxWirePro: GBP/USD hits one-month high, scope for further upside
  FxWirePro:EUR/NZD extends fall, key support lies ahead
  EUR/USD Holds Bullish Tone Despite Pullback from Yesterday’s High
  FxWirePro- Major Crypto levels and bias summary
  FxWirePro- Major Crypto levels and bias summary
  GBPJPY Bullish Surge: Strong Pound Ignites Fresh Upside on Fed-BOE Policy Divergence as All EMAs Align
  GBPJPY Bullish on Consolidation: Holds Above 216 After 218 Top – Buy Dips at 217 Targeting 220
  FxWirePro: NZD/USD steadies around 0.5830,retains bid tone


 - EconoTimes)


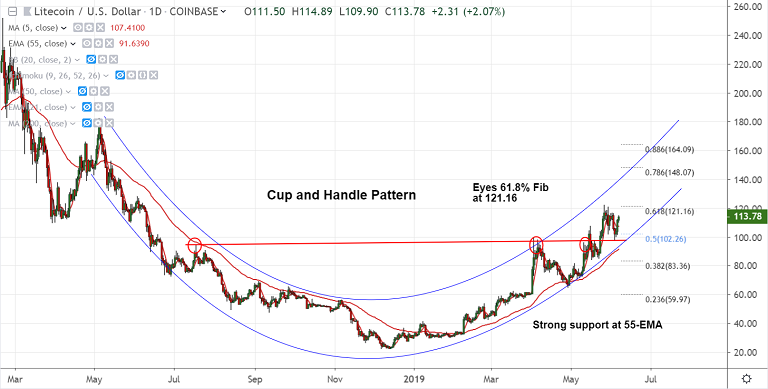
LTC/USD chart - Trading View
Exchange - Coinbase
Support: 104.27 (21-EMA); Resistance: 127 (Rising Trendline)
Technical Analysis: Bias Bullish
LTC/USD failed to close below 21-EMA, bias has turned bullish.
The pair is extending upside for the 3rd straight session, trades 2.20% higher at 113.92 at 07:35 GMT.
Price action has broken above 5-DMA and 200H-SMA. Volatility is rising on the intraday charts.
'Cup and Handle' pattern seen on the daily charts. Price extends gains in accordance.
The pair has ignored a Doji formation on the previous weeks candle. RSI has turned on the daily charts.
Long wick on the downside shows buying pressure at lows. Scope for test of 127 (trendline)
Immediate support is seen at 200H SMA at 109.34. Weakness only on close below 21-EMA.
For details on FxWirePro's Currency Strength Index, visit http://www.fxwirepro.com/currencyindex.


