


 ETH Stands Alone Bullish; BTC, SOL, XRP, BNB Neutral
  GBPJPY Bullish Surge: Strong Pound Ignites Fresh Upside on Fed-BOE Policy Divergence as All EMAs Align
  Crypto Major Pair Action Bias: ETHUSD Bullish as BTCUSD, SOLUSD & XRPUSD Stay Neutral
  FxWirePro- Major Crypto levels and bias summary
  GBPJPY Bullish on Consolidation: Holds Above 216 After 218 Top – Buy Dips at 217 Targeting 220
  FxWirePro: NZD/USD trades in narrow range ,outlook bullish
  GBPUSD, AUDUSD & NZDUSD Turn Extremely Bullish: Strong Positive Momentum Drives Major Pair Action Bias
  FxWirePro- Major Crypto levels and bias summary
  FxWirePro- Major Crypto levels and bias summary
  FxWirePro: AUD/USD edges lower, but bullish outlook persists


LTC/USD chart - Trading View
Exchange - Coinbase
Major Support Levels:
S1: 72.32 (21-EMA)
S2: 69.47 (61.8% Fib)
S3: 63.87 (Sept 6 low)
Major Resistance Levels:
R1: 78.11 (55-EMA)
R2: 81.86 (23.6% Fib)
R3: 84.00 (110-EMA)
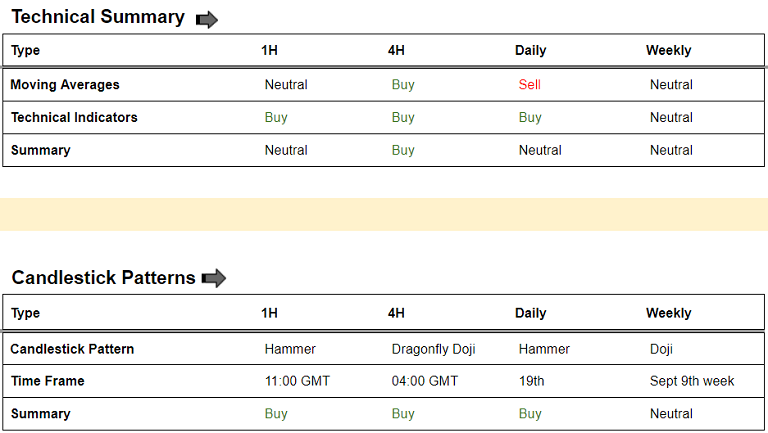
Summary: LTC/USD pared losses overnight, failed to complete the 'Bearish Engulfing' candlestick pattern. 'Hammer' formed on 19th day's candle suggests buying pressure at lows. Technical studies keep scope for upside. 55-EMA is stiff resistance at 78.11. Decisive breakout to drive prices higher.
Guidance: Good to go long on breakout at 55-EMA. Target 1: 81.86 (23.6% Fib), Target 2: 84.00 (110-EMA). Stop Loss: 74.00.


