


 Major Currency Pair Scores: USD/CHF Signals Strong Bullish Momentum as NZD/USD Turns Heavily Bearish
  FxWirePro- Major Crypto levels and bias summary
  FxWirePro: USD/CAD maintains bullish bias with focus on 1.4000
  AUDJPY Trades in Narrow Range, Bearish Indicators Suggest Selling on Rallies
  FxWirePro- Major Crypto levels and bias summary
  FxWirePro: USD/JPY slips as yen firms after hot Japan's wholesale inflation data
  FxWirePro- Major Pair levels and bias summary


 Add as a preferred source on Google
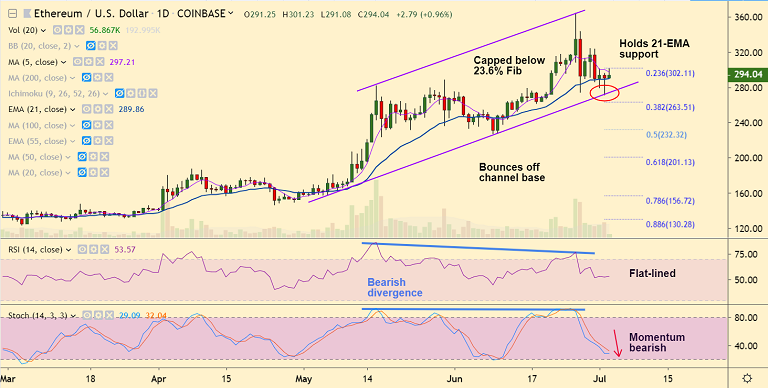
ETH/USD chart - Trading View
Exchange - Coinbase
Support: 289.81 (21-EMA); Resistance: 302.11 (23.6% Fib)
Technical Analysis: Bias neutral to slightly bearish
ETH/USD upside capped below 23.6% Fib. The pair edges lower from session highs at 301.23.
Recovery lacks traction, technical indicators are still biased lower.
RSI flat-lined, but holds above 53 levels. Momentum still bearish with Stochs sharply lower.
That said, the pair is extending price action is 'Rising Channel' pattern and price action has bounced off channel support.
'Hammer' pattern on previous days' candle raises scope for upside. Close above 5-DMA with turn in indicators should see upside resumption.
On the downside, 21-EMA is strong support. The pair is managing to hold above. Decisive breach below will see further weakness.
For details on FxWirePro's Currency Strength Index, visit http://www.fxwirepro.com/currencyindex.







