


 FxWirePro- Woodies pivot (Major)
  FxWirePro: AUD/USD remains buoyant, looks to extend gains
  ETHUSD Bullish Momentum: Follows BTC Above All EMAs, Buy Dips Near $1750 Targeting $2300
  FxWirePro: USD/CAD falls after BoC rate hold and weak U.S. producer inflation
  FxWirePro: USD/JPY uptrend loses steam, remains on bullish path
  ETH Stands Alone Bullish; BTC, SOL, XRP, BNB Neutral
  FxWirePro: NZD/USD trades in narrow range ,outlook bullish
  JPY Action Bias: Extremely Bullish Surge Ignites Across NZD, GBP & AUD
  FxWirePro- Woodies pivot (Major)


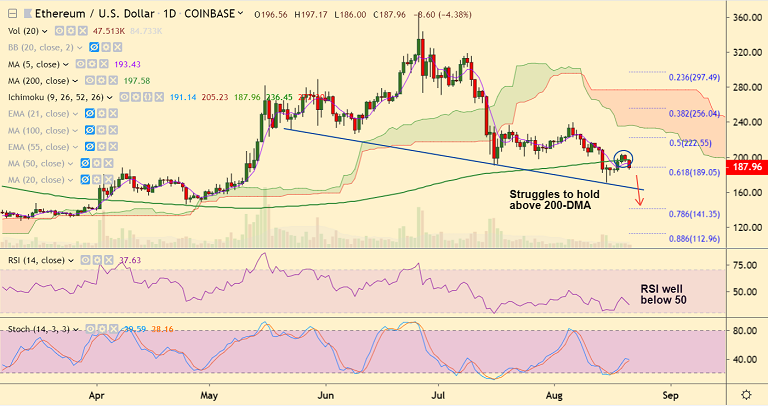
ETH/USD chart - Trading View
Exchange - Coinbase
Support: 171 (Aug 15 low); Resistance: 197.58 (200-DMA)
Technical Analysis: Bias Bearish
ETH/USD extends weakness for the 2nd straight session, bias turning bearish.
The pair has failed to extend gains above $200 mark, slips lower.
Major trend is bearish as shown by GMMA indicator. Parabolic SAR also supports weakness.
Price has slipped below 200-DMA and 200 SMA on the hourly charts. Hovers around 61.8% Fib.
RSI and Stochs are now biased lower. Volatility rising on the intraday charts.
Break below 61.8% Fib (189.05) will see dip till 171 (Aug 15 low) ahead of 165.75 (trendline).
200-DMA is now major resistance at 197.58. Retrace above will see further consolidation.


