


 EUR/USD Holds Bullish Tone Despite Pullback from Yesterday’s High
  FxWirePro- Major Crypto levels and bias summary
  FxWirePro:EUR/NZD dips below lower range, bearish bias increases
  FxWirePro:EUR/NZD stuck In narrow ranges, focus on near term support
  FxWirePro: USD/JPY uptrend loses steam, remains on bullish path
  FxWirePro: GBP/USD under pressure despite UK's modest economic growth
  AUDJPY Bullish Surge: Strong Australian Dollar Fuels Fresh Upside as Pair Holds Above 113.50 and All EMAs Align
  FxWirePro: USD/CAD falls after BoC rate hold and weak U.S. producer inflation
  FxWirePro: NZD/USD trades in narrow range ,outlook bullish
  ETH Stands Alone Bullish; BTC, SOL, XRP, BNB Neutral


 - EconoTimes)


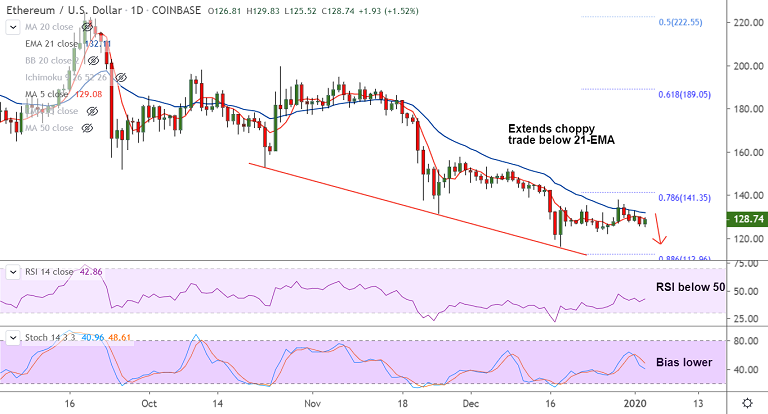
ETH/USD chart - Trading View
Exchange - Coinbase
Support: 133.57 (21-EMA); Resistance: 144.57 (55-EMA)
Technical Analysis: Bias Bullish
ETH/USD is extending break above 21-EMA, scope for further upside.
The pair was trading 3.16% higher on the day at 139.52 at 04:55 GMT, after closing 0.87% higher in the previous session.
On the weekly charts the pair has resumed upside after 'Hammer' and back-to-back 'Dragonfly Doji' formations.
Technical indicators have turned bullish and support further gains. Stochs and RSI are biased higher. Volatility is also rising.
Price action is extending break above 4H 200 MA, is on track to test next major hurdle at 55-EMA at 144.57.
Break above cloud will shift major bias to bullish. Retrace below 21-EMA will negate upside bias.


