


 FxWirePro- Major Crypto levels and bias summary
  FxWirePro- Major Crypto levels and bias summary
  FxWirePro- Major Crypto levels and bias summary
  Major Pair Action Bias: Extremely Bullish Surge Powers GBPUSD & NZDUSD as Bullish Momentum Ignites
  FxWirePro: GBP/USD hits one-month high, scope for further upside
  FxWirePro: EUR/AUD outlook weaker on renewed downside pressure
  Gold Loses Steam After Strong U.S. Retail Sales
  FxWirePro: USD/JPY uptrend loses steam, remains on bullish path
  FxWirePro: USD/ZAR advances as South African rand weakens amid renewed Middle East tensions
  FxWirePro- Major Pair levels and bias summary
  FxWirePro- Woodies pivot (Major)


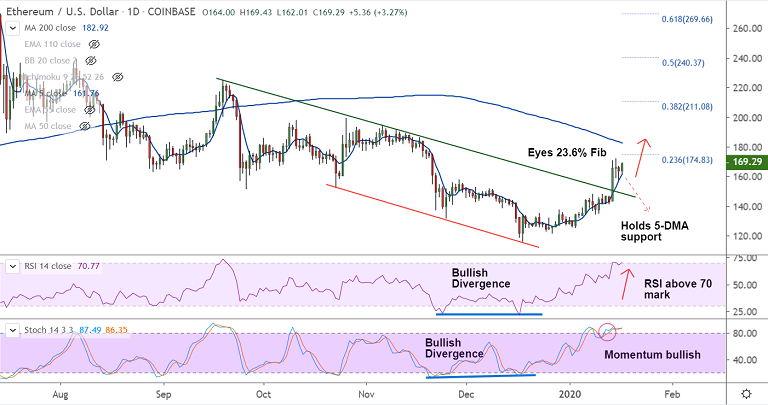
ETH/USD chart - Trading View
Exchange - Coinbase
Technical Analysis: Bias Bullish
GMMA Indicator: Major Trend - Turning slightly bullish; Minor Trend - Bullish
Overbought/ Oversold Index: Overbought
Volatility: High
Support: 158.53 (110-EMA); Resistance: 174.83 (23.6% Fib)
ETH/USD has likely resumed upside after a brief pause on Thursday's trade, bias remains bullish.
The pair was trading 2.79% higher on the day at 168.43 at around 05:45 GMT, after closing 1.42% lower in the previous session.
'Hammer' formation in the previous session shows buying pressure at lows. The pair trimmed losses from lows of 158.17 to close at 163.93.
Technical studies are biased higher. However, overbought oscillators could cause minor pullbacks.
The pair finds immediate support at 5-DMA (161.62) which is biased higher. Break below could see minor weakness.
Breach below cloud top support (155.43) could see drag till 200H MA at 149.25. Violation there could change near-term dynamics.
On the other side, 23.6% Fib is immediate resistance at 174.83. Break above 200-DMA (183.53) confirms bullish continuation.


