


 FxWirePro: GBP/AUD struggle to extend its recovery, good to sell on rally
  JPY Major Currency Score: All Bearish
  FxWirePro- Woodies Pivot (Major)
  FxWirePro: USD/ZAR hits three-week high after hot U.S. PPI data
  FxWirePro- Major Crypto levels and bias summary
  FxWirePro: EUR/AUD dips below 1.6200 level ,vulnerable to more downside
  AUDJPY Trades in Narrow Range, Bearish Indicators Suggest Selling on Rallies
  FxWirePro- Major Crypto levels and bias summary
  FxWirePro: USD/CAD firms slightly, but downward resumption looks likely
  FxWirePro: EUR/NZD gaining momentum for a move towards 2.0100 level
  FxWirePro: EUR/AUD scales one-week peak after ECB rate hike


 Add as a preferred source on Google
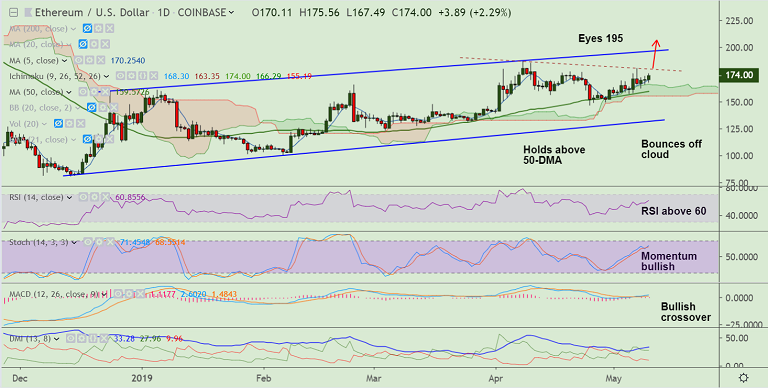
ETH/USD chart - Trading View
Exchange - Coinbase
Support: 170.31 (5-DMA); Resistance: 180 (Trendline)
Technical Analysis: Bias Bullish
- ETH/USD extends gains, poised for test of 195 mark
- The pair has found strong support at daily cloud and weakness only on break below
- Momentum bullish, Stochs and RSI are sharply higher, MACD is showing a bullish crossover on signal line
- GMMA indicators shows both near and long term averages are in concurrence and biased higher
- Pair could find some resistance at Upper Bollinger Band at 177 mark. Break above 180 (trendline) sees little resistance till 195
- 5-DMA is immediate support at 170.31. Break below could see dip till 50-DMA at 159.57. Bullish invalidation below cloud (155)
For details on FxWirePro's Currency Strength Index, visit http://www.fxwirepro.com/currencyindex.

- News

- Economy

- Central Banks
- Investing
- Research
- Roundups
- Digital Currency
- Insights
- Technical Analysis
- Technology
- Business
- Law
- Health
- Nature
- Fintech
- Science
- Topic
- Opinions
- ©Econometrics LLC . All Rights Reserved.
Crypto Technicals: ETH/USD holds cloud support, poised for test of 195 mark
Friday, May 10, 2019 7:21 AM UTC
Editor's Picks



- Market Data
Most Popular




