


 FxWirePro: AUD/USD edges lower, but bullish outlook persists
  Crypto Major Pair Action Bias: ETHUSD Bullish as BTCUSD, SOLUSD & XRPUSD Stay Neutral
  ETH Stands Alone Bullish; BTC, SOL, XRP, BNB Neutral
  FxWirePro: USD/CAD falls after BoC rate hold and weak U.S. producer inflation
  FxWirePro: USD/ZAR advances as South African rand weakens amid renewed Middle East tensions
  JPY Action Bias: Extremely Bullish Surge Ignites Across NZD, GBP & AUD
  FxWirePro: GBP/NZD gains some upside momentum but still bearish
  FxWirePro- Major Crypto levels and bias summary
  FxWirePro:EUR/NZD dips below lower range, bearish bias increases


, break below will accentuate weakness - EconoTimes)


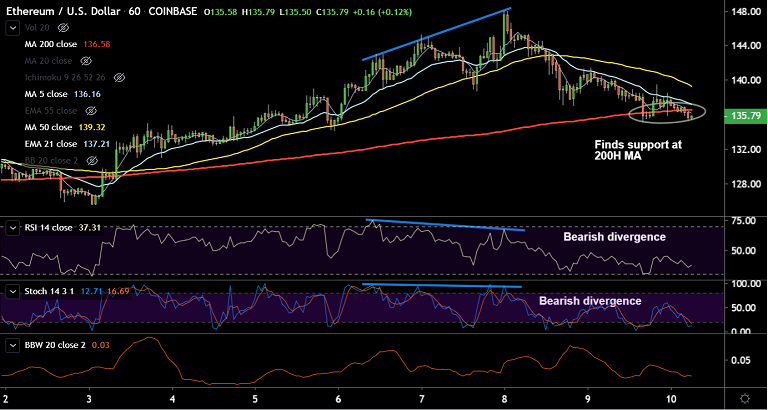
ETH/USD chart - Trading View
Exchange - Coinbase
Technical Analysis: Bias Bearish
GMMA Indicator: Major Trend - Bearish; Minor Trend - Turning Bearish
Overbought/ Oversold Index: Neutral
Support: 135.57 (21-EMA); Resistance: 140.24 (5-DMA)
ETH/USD is extending weakness for the 4th straight session, trades 1.50% lower at 135.81 at 05:45 GMT. The pair is extending weakness after failure at 55-EMA. Scope for further downside.
Technical indicators are turning bearish. Stochs and RSI have rolled over from overbought levels and are biased lower. The pair is currently holding above 21-EMA support at 135.60. Break below will accentuate weakness.
Major trend as evidenced by the GMMA indicator has been bearish. Long-term moving averages are biased lower. Short-term moving averages are now turning south suggesting a bearish shift in the near-term trend. Stochastics RSI is also on verge of rollover from overbought levels.
On the hourly charts, the pair is hovering around 200H MA which is strong support at 136.58. Decisive break below will add to the bearish bias. Further, a bearish divergence on RSI and Stochs supports weakness.
Next immediate support below 21-EMA lies at 20-DMA at 132.41 ahead of 125.52 (Jan 3rd low). 5-DMA is immediate resistance at 140.26. Breakout at 55-EMA required for meaningful upside.


