


 Major Pair Action Bias: Extremely Bullish Surge Powers GBPUSD & NZDUSD as Bullish Momentum Ignites
  FxWirePro: USD/ZAR advances as South African rand weakens amid renewed Middle East tensions
  FxWirePro: GBP/NZD gains some upside momentum but still bearish
  FxWirePro- Major Pair levels and bias summary
  Crypto Major Pair Action Bias: ETHUSD Bullish as BTCUSD, SOLUSD & XRPUSD Stay Neutral
  FxWirePro: USD/CAD falls after BoC rate hold and weak U.S. producer inflation
  FxWirePro- Major Crypto levels and bias summary


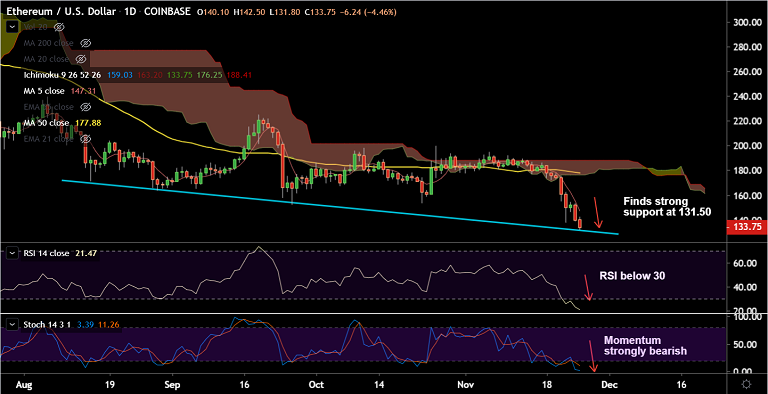
ETH/USD chart - Trading View
Exchange - Coinbase
Support: 131.50 (Trendline support); Resistance: 141.35 (78.6% Fib)
Technical Analysis: Bias strongly Bearish
ETH/USD is extending previous week's weakness, trades 4.96% lower on the day at 133.19 at 06:00 GMT.
The pair has hit 8-month lows below the $140 mark and more downside on charts.
Technical indicators are strongly bearish. Major and minor trend are bearish as evidenced by GMMA indicator. Volatility is rising.
Price action has broken below 78.6% Fib at 141.35, is on track for further weakness.
Strong trendline support is seen at 131.50. Break below will open up downside.
Next major support is seen at 122.75 (Mar 4th low), ahead of 112.96 (88.6% Fib).


