


 FxWirePro: GBP/USD hits one-month high, scope for further upside
  ETHUSD Bullish Momentum: Follows BTC Above All EMAs, Buy Dips Near $1750 Targeting $2300
  EUR/USD Holds Bullish Tone Despite Pullback from Yesterday’s High
  GBPJPY Bullish Surge: Strong Pound Ignites Fresh Upside on Fed-BOE Policy Divergence as All EMAs Align
  FxWirePro:EUR/NZD dips below lower range, bearish bias increases
  FxWirePro: GBP/NZD gains some upside momentum but still bearish
  FxWirePro: EUR/AUD outlook weaker on renewed downside pressure
  FxWirePro: USD/JPY uptrend loses steam, remains on bullish path


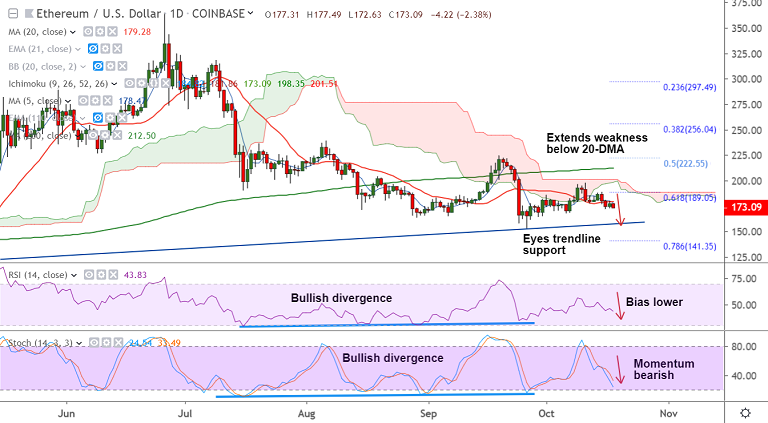
ETH/USD chart - Trading View
Exchange - Coinbase
Support: 167.50 (Oct 6 low); Resistance: 179 (converged 5 and 20 DMAs)
Technical Analysis: Bias Bearish
ETH/USD struggles to extend recovery above 179 mark, bias remains bearish.
The pair is extending weakness on the day, following slump in Bitcoin prices.
ETH/USD was trading 2.22% lower on the day at 173.46 after closing 1.61% higher on Thursday's trade.
Price action is extending weakness below 20-DMA support and is now on track to test Oct 6th lows at 167.50.
Major and minor trend are bearish as indicated by GMMA indicator. Break below 167.50 will see test of trendline support at 158 level.
Volatility is low. Bullish divergence could limit downside.
Also Stochastics oscillator on weekly charts has approached oversold zone.
Retrace above strong resistance at 179 (nearly converged 5 and 20 DMAs) to see more gains. Bearish invalidation only above 200-DMA.


