


 Crypto Major Pair Action Bias: ETHUSD Bullish as BTCUSD, SOLUSD & XRPUSD Stay Neutral
  FxWirePro: AUD/USD edges lower, but bullish outlook persists
  FxWirePro- Major Crypto levels and bias summary
  EUR/USD Holds Bullish Tone Despite Pullback from Yesterday’s High
  AUDJPY Bullish Surge: Strong Australian Dollar Fuels Fresh Upside as Pair Holds Above 113.50 and All EMAs Align
  FxWirePro- Major Crypto levels and bias summary
  FxWirePro- Major Crypto levels and bias summary
  FxWirePro: USD/JPY uptrend loses steam, remains on bullish path
  FxWirePro: GBP/USD hits one-month high, scope for further upside
  NZDJPY Bullish Surge: Strong Kiwi Ignites Fresh Upside as 94 Support Holds and All EMAs Align
  FxWirePro- Major Crypto levels and bias summary


, break above to propel the pair higher - EconoTimes)


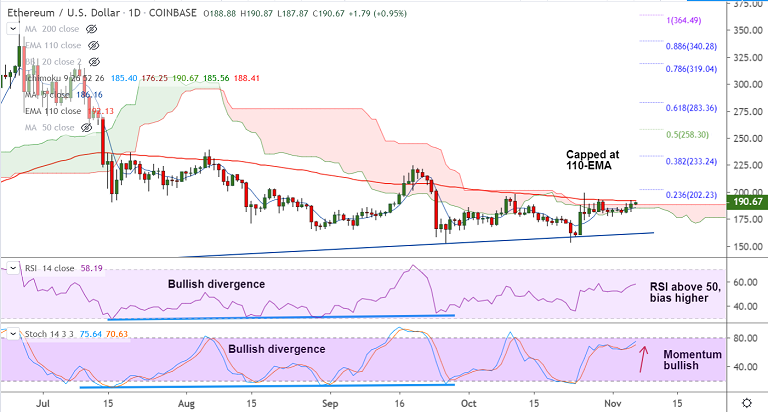
ETH/USD chart - Trading View
Exchange - Coinbase
Support: 186.26 (5-DMA); Resistance: 192.13 (110-EMA)
Technical Analysis: Bias bullish
ETH/USD is extending gains for the 3rd straight session, trades 1.13% higher at 191.01 at 04:28 GMT.
The pair is trading with a slight bullish bias. Technical indicators are turning bullish.
RSI and Stochs are biased higher, RSI is above 50 with room to run further. Volatility is rising.
GMMA shows shift in the near-term trend with short-term MAs breaking above long-term MAs.
Upside finds stiff resistance at 110-EMA at 192.13. Break above will propel the pair higher.
Next major hurdle lies at 23.6% Fib at 202.23. Break above will take the pair to 200-DMA at 213.57.
On the flipside, 5-DMA is immediate support at 186.15. Break below 21-EMA negates near-term bullishness.


