


 FxWirePro: NZD/USD trades in narrow range ,outlook bullish
  FxWirePro: NZD/USD steadies around 0.5830,retains bid tone
  FxWirePro- Woodies pivot (Major)
  BTCUSD Bullish Breakout: Clears 800-EMA After Consolidation, Buy Dips Toward $74,900
  FxWirePro- Major Crypto levels and bias summary
  FxWirePro: AUD/USD edges lower, but bullish outlook persists
  Crypto Major Pair Action Bias: ETHUSD Bullish as BTCUSD, SOLUSD & XRPUSD Stay Neutral
  Gold Loses Steam After Strong U.S. Retail Sales
  NZDJPY Bullish Surge: Strong Kiwi Ignites Fresh Upside as 94 Support Holds and All EMAs Align
  ETHUSD Bullish Momentum: Follows BTC Above All EMAs, Buy Dips Near $1750 Targeting $2300
  ETH Stands Alone Bullish; BTC, SOL, XRP, BNB Neutral
  Major Pair Action Bias: Extremely Bullish Surge Powers GBPUSD & NZDUSD as Bullish Momentum Ignites


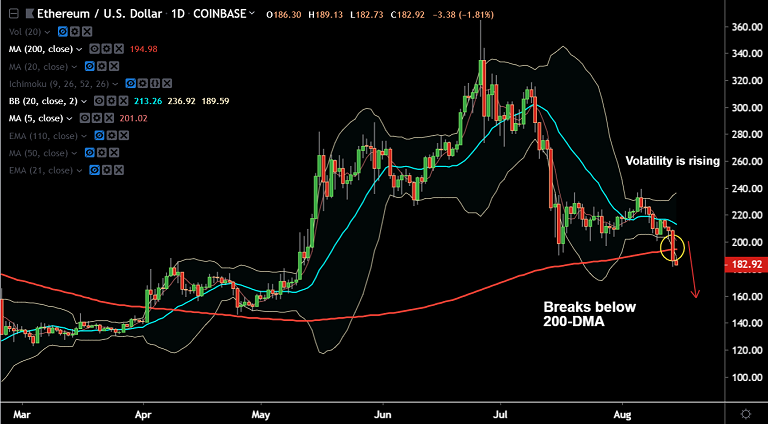
ETH/USD chart - Trading View
Exchange - Coinbase
Support: 168 (trendline); Resistance: 189.05 (61.8% Fib)
Technical Analysis: Bias Bearish
ETH/USD has breached 200-DMA support, opening up further downside.
The pair hit 14-week lows at 178.26, technical bias is strongly bearish.
RSI is well below 50 levels and Stochs show momentum is strongly bearish.
MACD shows a bearish crossover on signal line and volatility is rising as shown by expanding Bollinger bands.
Negative DMI dominance seen and ADX is rising in support of the downtrend.
Price action has slipped below 61.8% Fib and is on track to test trendline support at 168.
200-DMA is now turned resistance at 194.97. Retrace above to extend consolidation.


