


 FxWirePro- Major Pair levels and bias summary
  FxWirePro- Major Crypto levels and bias summary
  JPY Major Currency Score: All Bearish
  NZDJPY Consolidates, Resistance at 90.78 May Signal Favorability for Downtrend
  FxWirePro: EUR/NZD eases after hot US CPI data
  FxWirePro: EUR/AUD scales one-week peak after ECB rate hike
  FxWirePro: USD/ZAR hits three-week high after hot U.S. PPI data
  FxWirePro- Major Crypto levels and bias summary
  FxWirePro: USD/ZAR bearish again as upside bias reverses
  FxWirePro- Major Crypto levels and bias summary


 Add as a preferred source on Google
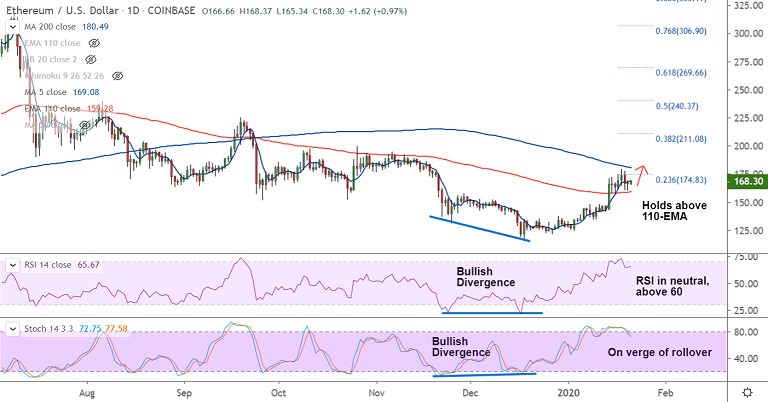
ETH/USD chart - Trading View
Exchange - Coinbase
Technical Analysis: Bias Bullish
Support: 162.51 (200H MA); Resistance: 169.05 (5-DMA)
ETH/USD was trading 0.89% higher on the day at 168.17, after closing largely muted on the previous day.
The pair has bounced off 200H MA at 162.51 and is holding above 110-EMA at 159.28.
A 'Dragonfly Doji' formation on the previous days' candle raises scope for further upside.
Major trend in the pair has shown a shift higher, while short-term moving averages have crossed over long-term MAs.
Price action is now sandwiched between 110-EMA and 200-DMA. Breakout at 200-DMA will propel the pair higher.
Next major resistance lies at 55W EMA at 197.80 ahead of 110W EMA at 209.56 and 38.2% Fib at 211.08.
On the flipside, break below 110-EMA at 159.27 will see dip till 55-EMA at 150.20. Breach below 55-EMA negates near-term bullish bias.







