


 FxWirePro- Woodies pivot (Major)
  GBPJPY Bullish on Consolidation: Holds Above 216 After 218 Top – Buy Dips at 217 Targeting 220
  FxWirePro: AUD/USD remains buoyant, looks to extend gains
  NZDJPY Extremely Bullish Above 94: Broad NZD Buying Fuels Fresh Upside – Buy Dips at 93.70 Targeting 95
  GBPJPY Bullish Surge: Strong Pound Ignites Fresh Upside on Fed-BOE Policy Divergence as All EMAs Align
  FxWirePro: USD/JPY uptrend loses steam, remains on bullish path
  FxWirePro: USD/CAD falls after BoC rate hold and weak U.S. producer inflation
  Major Pair Action Bias: Extremely Bullish Surge Powers GBPUSD & NZDUSD as Bullish Momentum Ignites
  FxWirePro- Major Crypto levels and bias summary


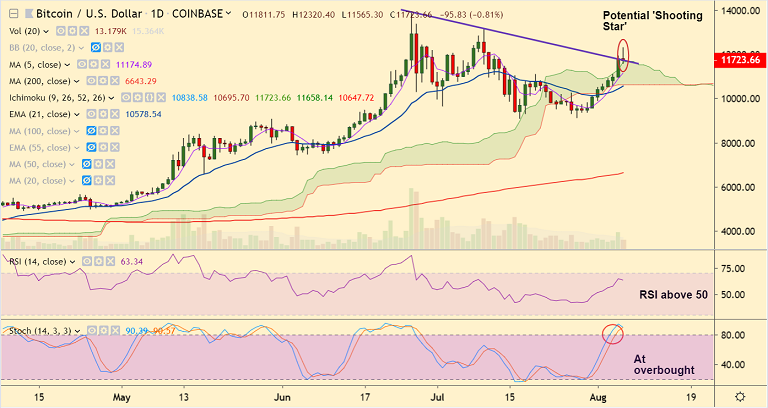
BTC/USD chart - Trading View
Exchange - Coinbase
Support: 11658 (cloud top); Resistance: 12,000 (psychological level)
Technical Analysis: Bias Bullish
BTC/USD extended its bull run in the Asian session, broke above strong trendline resistance to hit 4-week highs above $12,000 mark.
However, the pair struggled to hold gains above 12,000. Price action has slipped from highs at 12320 and is currently at 11684 at 12:35 GMT.
A potential 'Shooting Star' candlestick pattern at highs raises scope for some reversal.
On the hourly charts, the pair has slipped below 21H EMA and eyes strong support at 55H EMA at 11519.
Failure to hold above cloud will see dip till 21-EMA at 10572. Breach at 21-EMA could see further weakness.
On the flipside, close above 12,000 mark will see bullish continuation.


