


 FxWirePro: EUR/AUD outlook weaker on renewed downside pressure
  FxWirePro- Major Pair levels and bias summary
  FxWirePro :USD/JPY bulls loosen their grip a bit, dips to be bought
  FxWirePro:EUR/NZD extends fall, key support lies ahead
  BTCUSD Bullish Breakout: Clears 800-EMA After Consolidation, Buy Dips Toward $74,900
  ETH Stands Alone Bullish; BTC, SOL, XRP, BNB Neutral
  NZDJPY Extremely Bullish Above 94: Broad NZD Buying Fuels Fresh Upside – Buy Dips at 93.70 Targeting 95


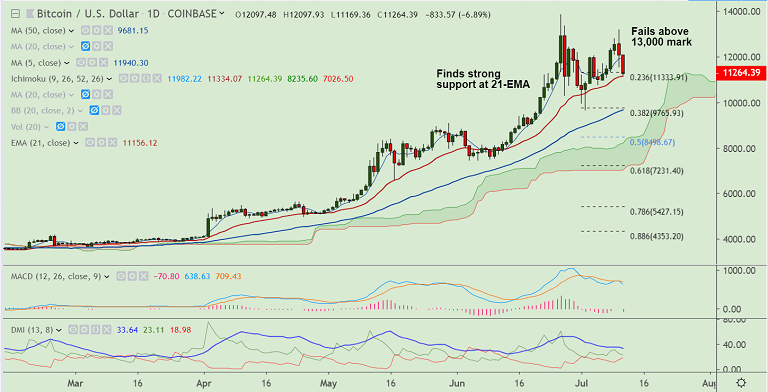
BTC/USD chart - Trading View
Exchange - Coinbase
Support: 11156 (21-EMA); Resistance: 12000
Technical Analysis: Major trend remains bullish, intraday bias turning slightly bearish
BTC/USD sold off above $13,000, hits new weekly lows at $11,169.
The pair finds strong support at 21-EMA (11156), decisive break below will see further weakness.
Major trend in the pair remains bullish. We do not see any major signs of reversal yet.
Price action has edged lower after testing upper Bollinger band. Break below 21-EMA could see drag till lower Bollinger band (10140).
The pair has slipped below 200 SMA on the 1H and 2H charts. Dips accompanied by strong volumes may be a concern for bulls.
Fundamental reasons behind the sell-off still unknown. Profit taking at highs is likely to have triggered the move.
GMMA indicator still shows upside on the weekly and daily charts. A potential 'Gravestone' Doji on the weekly charts could add to the bearish bias.
For details on FxWirePro's Currency Strength Index, visit http://www.fxwirepro.com/currencyindex.


