


 Crypto Major Pair Action Bias: ETHUSD Bullish as BTCUSD, SOLUSD & XRPUSD Stay Neutral
  NZDJPY Bullish Surge: Strong Kiwi Ignites Fresh Upside as 94 Support Holds and All EMAs Align
  Gold Loses Steam After Strong U.S. Retail Sales
  GBPUSD, AUDUSD & NZDUSD Turn Extremely Bullish: Strong Positive Momentum Drives Major Pair Action Bias
  ETH Stands Alone Bullish; BTC, SOL, XRP, BNB Neutral
  FxWirePro- Major Pair levels and bias summary
  FxWirePro- Major Crypto levels and bias summary
  BTCUSD Bullish Breakout: Clears 800-EMA After Consolidation, Buy Dips Toward $74,900


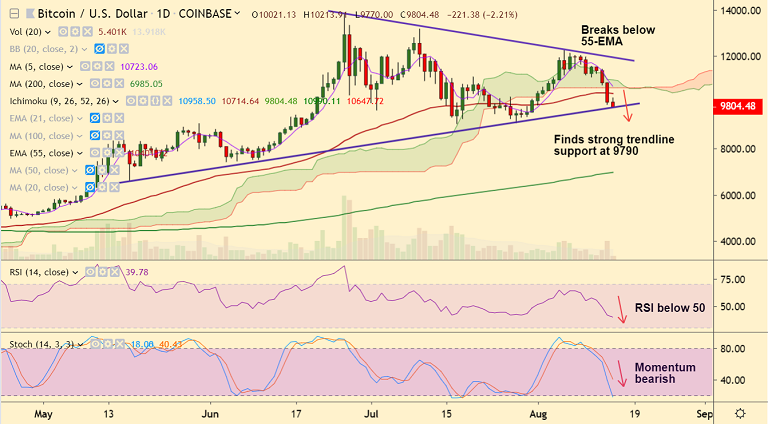
BTC/USD chart - Trading View
Exchange - Coinbase
Support: 9656 (100-DMA); Resistance: 10407 (55-EMA)
Technical Analysis: Bias Bearish
BTC/USD consolidates previous session's slump, trades 2.20% lower at 9800 at 04:00 GMT.
The pair is extending weakness below daily cloud, hits news August month lows at 9,770.
Technical indicators are bearish, scope for further downside. Stochs ans RSI are sharply lower and RSI is well below 50 level.
MACD shows bearish crossover on signal line and -ve DMI crossover on +ve DMI adds to the bearish bias.
Strong trendline support seen at 9790. Break below will see further downside. Next major support aligns at 100-DMA at 9656 ahead of 110-EMA at 9313.
Oscillators on the intraday charts are in oversold territory. Scope for minor pullbacks.
Retrace above 55-EMA (10407) will see consolidation. Break above 21-EMA (10824) negates near-term bearishness.


