


 FxWirePro: GBP/AUD struggle to extend its recovery, good to sell on rally
  Upbeat UK GDP Fails to Lift GBP/JPY as Bears Target 207
  FxWirePro- Woodies Pivot (Major)
  AUDJPY Trades in Narrow Range, Bearish Indicators Suggest Selling on Rallies
  FxWirePro- Major Crypto levels and bias summary
  FxWirePro: EUR/AUD scales one-week peak after ECB rate hike
  FxWirePro: USD/ZAR hits three-week high after hot U.S. PPI data
  FxWirePro: USD/ZAR bearish again as upside bias reverses
  NZDJPY Consolidates, Resistance at 90.78 May Signal Favorability for Downtrend
  FxWirePro- Major Crypto levels and bias summary
  FxWirePro: USD/JPY slips as yen firms after hot Japan's wholesale inflation data


 Add as a preferred source on Google
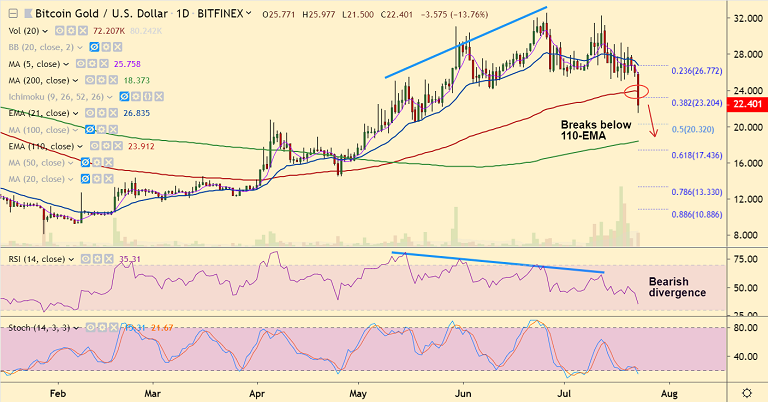
BTG/USD chart - Trading View
Exchange - Bitfinex
Technical Analysis: Bias Turning Bearish
Support: 20.32 (50% Fib), 18.37 (200-DMA), 17.43 (61.8% Fib)
Resistance: 23.90 (110-EMA), 25.72 (5-DMA), 26.27 (55-EMA)
BTG/USD has nose-dived in the past 1 hour to hit 2-month lows at 21.50.
The reason for the sudden downside is unclear as of now.
The pair has slumped over 17% on the day, bias is turning bearish.
Price action has slipped below 110-EMA support. Breaks below 38.2% Fib retracement.
Stochs and RSI are sharply lower. Volatility is rising. Bearish RSI divergence adds to the downside bias.
Bears likely to target next major support at 50% Fib at 20.32. Further weakness will see test of 200-DMA at 18.37.
For details on FxWirePro's Currency Strength Index, visit http://www.fxwirepro.com/currencyindex.







