


 FxWirePro: USD/JPY slips as yen firms after hot Japan's wholesale inflation data
  Gold Loses Luster Amid Rising US Bond Yields, Iran Conflict; Sell on Rallies Advised
  FxWirePro: USD/CNY sees some bounce after yesterday's fall
  FxWirePro- Major Crypto levels and bias summary
  FxWirePro: EUR/AUD scales one-week peak after ECB rate hike
  FxWirePro: EUR/NZD gaining momentum for a move towards 2.0100 level
  FxWirePro- Woodies Pivot (Major)
  FxWirePro: EUR/AUD dips below 1.6200 level ,vulnerable to more downside
  FxWirePro: GBP/NZD gains some upside momentum but still bearish
  FxWirePro: GBP/AUD struggle to extend its recovery, good to sell on rally
  FxWirePro- Woodies Pivot (Major)


 - EconoTimes)


 Add as a preferred source on Google
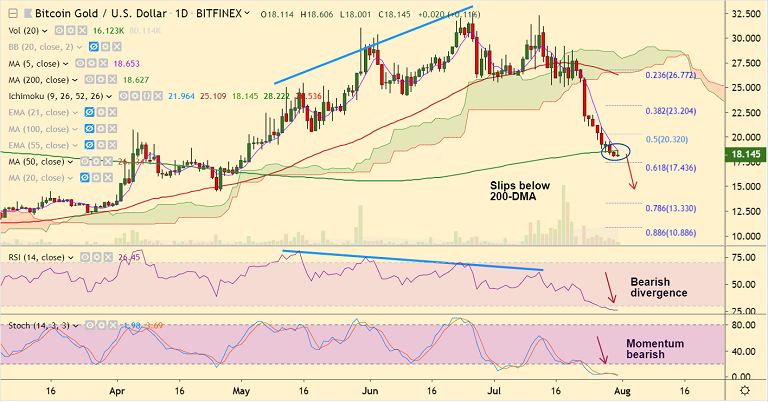
BTG/USD chart - Trading View
Exchange - Bitfinex
Support: 17.436 (61.8% Fib); Resistance: 16.685 (200-DMA)
Technical Analysis: Bias Bearish
BTG/USD is extending weakness below 200-DMA, eyes 61.8% Fib retracement at 17.43.
Price action has slipped below 20W SMA and minor recovery attempts capped at 200-DMA.
Scope for test of lower Bollinger Band on the weekly charts at 11.594.
Oscillators on the daily charts are in oversold territory. Hence, caution advised as the price may see minor pullback.
Major trend has definitely shifted to bearish as indicated by moves on the GMMA indicator.
Next immediate support lies at 61.8% Fib at 17.43 ahead of 14.46 (Apr 2019 lows) and then 11.59 (Lower BB).
Retrace above 200-DMA could see gains till 21-W EMA at 22.28. Break above negates near-term bearishness.
For details on FxWirePro's Currency Strength Index, visit http://www.fxwirepro.com/currencyindex.







