


 JPY Action Bias: Extremely Bullish Surge Ignites Across NZD, GBP & AUD
  FxWirePro: AUD/USD remains buoyant, looks to extend gains
  FxWirePro: GBP/NZD gains some upside momentum but still bearish
  GBPJPY Bullish on Consolidation: Holds Above 216 After 218 Top – Buy Dips at 217 Targeting 220
  FxWirePro :USD/JPY bulls loosen their grip a bit, dips to be bought
  ETH Stands Alone Bullish; BTC, SOL, XRP, BNB Neutral
  GBPJPY Bullish Surge: Strong Pound Ignites Fresh Upside on Fed-BOE Policy Divergence as All EMAs Align
  AUDJPY Bullish Surge: Strong Australian Dollar Fuels Fresh Upside as Pair Holds Above 113.50 and All EMAs Align


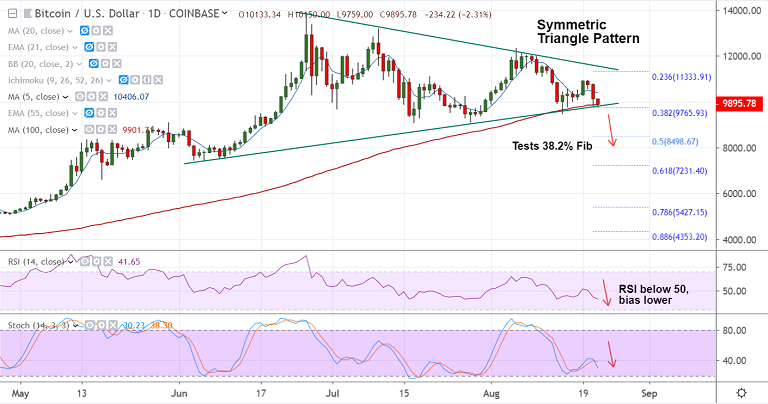
BTC/USD chart - Trading View
Exchange - Coinbase
Support: 9446 (110-EMA); Resistance: 10392 (5-DMA)
Technical Analysis: Bias Bearish
BTC/USD edges higher from session lows at 9759, trades 1.98% lower at 9929 at 03:15 GMT.
The pair is extending weakness for the 3rd straight session after upside was rejected at 20-DMA resistance.
Price action briefly dipped below 100-DMA to test 38.2% Fib at 9765, technical studies are bearish.
Stochs are RSI are sharply lower and RSI is well below 50 levels. Intraday volatility is rising.
Price action rages in 'Symmetric Triangle pattern and breach below Triangle base could plummet prices further.
Next major support lies at 110-EMA at 9448. Immediate resistance is at 5-DMA at 10406. Break above 20-DMA required for upside continuation.


