


 JPY Action Bias: Extremely Bullish Surge Ignites Across NZD, GBP & AUD
  GBPUSD, AUDUSD & NZDUSD Turn Extremely Bullish: Strong Positive Momentum Drives Major Pair Action Bias
  FxWirePro:EUR/NZD dips below lower range, bearish bias increases
  ETH Stands Alone Bullish; BTC, SOL, XRP, BNB Neutral
  FxWirePro: AUD/USD remains buoyant, looks to extend gains
  FxWirePro: EUR/AUD outlook weaker on renewed downside pressure
  FxWirePro- Major Crypto levels and bias summary
  NZDJPY Bullish Surge: Strong Kiwi Ignites Fresh Upside as 94 Support Holds and All EMAs Align
  ETHUSD Bullish Momentum: Follows BTC Above All EMAs, Buy Dips Near $1750 Targeting $2300
  GBPJPY Bullish on Consolidation: Holds Above 216 After 218 Top – Buy Dips at 217 Targeting 220
  FxWirePro: AUD/USD edges lower, but bullish outlook persists
  FxWirePro- Woodies pivot (Major)


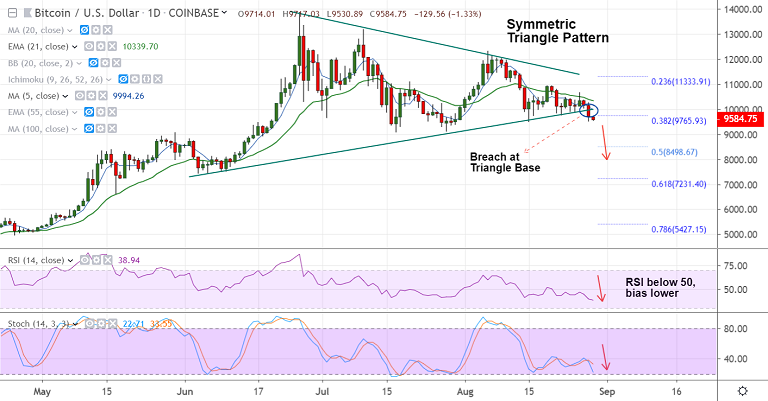
BTC/USD chart - Trading View
Exchange - Coinbase
Support: 9525 (110-EMA); Resistance: 9,999 (5-DMA)
Technical Analysis: Bias Bearish
BTC/USD extends previous session's weakness, trades 1.18% lower on the day at 9589 at 04:20 GMT.
The pair has shown a breach of 'Symmetric Triangle' pattern raising scope for downside.
Price action has slipped below 38.2% Fib. Technical indicators on the intraday charts are biased lower.
110-EMA is strong support (9525), break below eyes next major support at 9108 (28th July low).
5-DMA is immediate resistance at 9999. Breakout above cloud required for bearish invalidation.


