


 GBPJPY Bullish Surge: Strong Pound Ignites Fresh Upside on Fed-BOE Policy Divergence as All EMAs Align
  FxWirePro:EUR/NZD dips below lower range, bearish bias increases
  FxWirePro: GBP/USD hits one-month high, scope for further upside
  GBPJPY Bullish on Consolidation: Holds Above 216 After 218 Top – Buy Dips at 217 Targeting 220
  FxWirePro: GBP/NZD gains some upside momentum but still bearish
  FxWirePro: AUD/USD remains buoyant, looks to extend gains
  Crypto Major Pair Action Bias: ETHUSD Bullish as BTCUSD, SOLUSD & XRPUSD Stay Neutral
  FxWirePro- Woodies pivot (Major)
  NZDJPY Bullish Surge: Strong Kiwi Ignites Fresh Upside as 94 Support Holds and All EMAs Align
  FxWirePro- Major Crypto levels and bias summary
  JPY Action Bias: Extremely Bullish Surge Ignites Across NZD, GBP & AUD


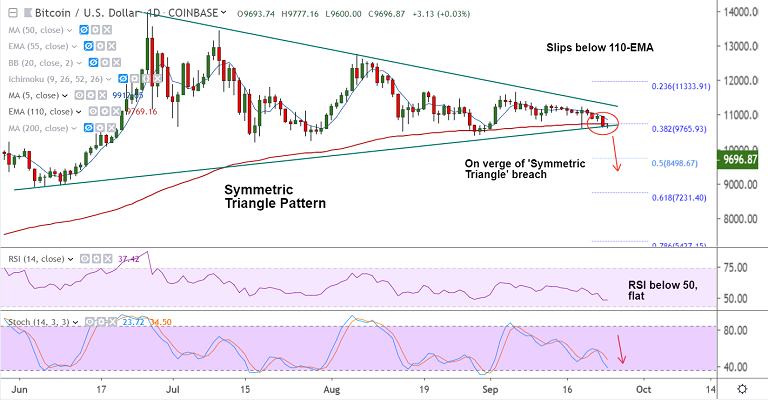
BTC/USD chart - Trading View
Exchange - Coinbase
Support: 9338 (21W EMA); Resistance: 5-DMA (9912)
Technical Analysis: Bias Bearish
BTC/USD slips below 110-EMA, tests triangle base support at 9630, bias is bearish.
RSI is well below 50 and Stochs are sharply lower. Volatility is rising on the daily charts.
MACD shows bearish crossover and ADX is rising in support of the current downtrend.
The pair is currently holding support at 9600 mark. Break below will see resumption of weakness.
Major trend is flat as shown in GMMA indicators. Parabolic SAR shows further downside.
'Symmetric Triangle' breach will plummet prices. Next major support lies at 9338 (21W EMA) ahead of 8498 (50% Fib).
On the flipside, 55-EMA is strong resistance at 10229, breakout negates near-term bearish bias.


