


 FxWirePro: AUD/USD edges lower, but bullish outlook persists
  FxWirePro: USD/JPY uptrend loses steam, remains on bullish path
  FxWirePro:EUR/NZD dips below lower range, bearish bias increases
  NZDJPY Bullish Surge: Strong Kiwi Ignites Fresh Upside as 94 Support Holds and All EMAs Align
  ETH Stands Alone Bullish; BTC, SOL, XRP, BNB Neutral
  FxWirePro: GBP/USD hits one-month high, scope for further upside
  GBPUSD, AUDUSD & NZDUSD Turn Extremely Bullish: Strong Positive Momentum Drives Major Pair Action Bias
  FxWirePro- Woodies pivot (Major)
  FxWirePro- Major Pair levels and bias summary
  GBPJPY Bullish on Consolidation: Holds Above 216 After 218 Top – Buy Dips at 217 Targeting 220


, break below will see further weakness - EconoTimes)


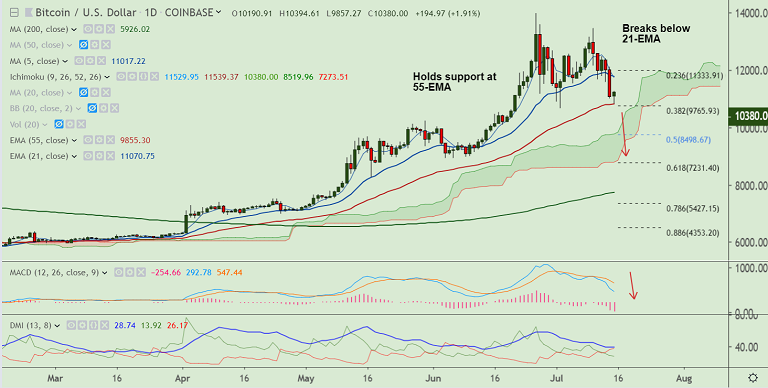
BTC/USD chart - Trading View
Exchange - Coinbase
Support: 9854 (55-EMA); Resistance: 11071 (21-EMA)
Technical Analysis: Bias Bearish
BTC/USD has edged higher from 13-day lows at 9857 and is currently trading at 10376 at 10:00 GMT.
The pair is showing scope for a potential 'hammer' formation on the daily charts raising scope for upside.
That said, price action has slipped below strong support at 21-EMA and technical indicators have turned bearish.
5-DMA is sharply lower and volatility is rising. Stochs and RSI are biased lower and RSI is well below 50, indicating strength in current downtrend.
Break below 55-EMA will see further weakness. Dip till 110-EMA at 8338 and then cloud top at 8519 likely.
Break below cloud will see further downside. Retrace above 21-EMA negates near-term bearish bias.
For details on FxWirePro's Currency Strength Index, visit http://www.fxwirepro.com/currencyindex.


