


 FxWirePro- Woodies pivot (Major)
  Gold Loses Steam After Strong U.S. Retail Sales
  FxWirePro- Major Crypto levels and bias summary
  FxWirePro: USD/ZAR advances as South African rand weakens amid renewed Middle East tensions
  FxWirePro: GBP/NZD downtrend loses steam, remains on bearish path
  Major Pair Action Bias: Extremely Bullish Surge Powers GBPUSD & NZDUSD as Bullish Momentum Ignites
  FxWirePro:EUR/NZD stuck In narrow ranges, focus on near term support


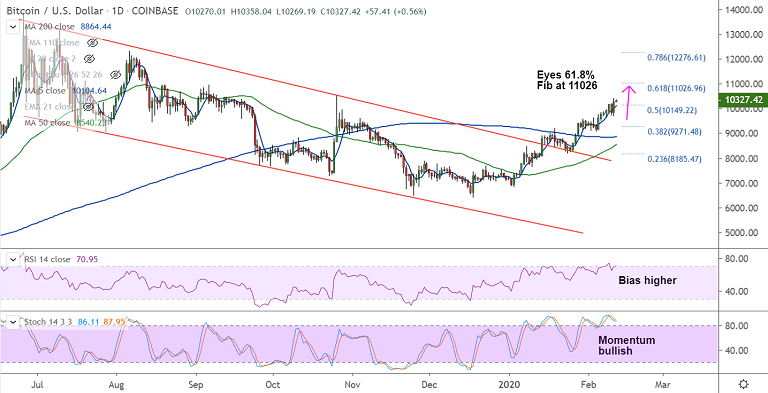
BTC/USD chart - Trading View
Exchange - Coinbase
Technical Analysis: Bias Bullish
GMMA Indicator: Major Trend - Bullish; Minor Trend - Bullish
Overbought/ Oversold Index: Overbought
Volatility: High and rising
Support: 10102 (5-DMA); Resistance: 10540 (Oct 26th high)
BTC/USD is extending bullish momentum, was trading 0.48% higher on the day at 10315 at around 09:40 GMT. After a brief pause on Monday's trade, the pair surged higher on Tuesday to close 4.25% higher at 10270.
The pair is in the green for the 3rd straight week and technical indicators are strongly bullish. Price action has broken above weekly cloud and volatility is rising as evidenced by widening Bollinger bands. 61.8% Fib retracement at 11,026 is next likely bull target.
Bitcoin's positive price action can be largely attributed to upcoming Bitcoin halving event which is likely to occur in May 2020 and could have a significant impact on the cryptocurrency's price. Robert Beadles, President of Monarch opines that Bitcoin has woven itself into the fabric of the financial system and adoption is steadily happening.
"These positive developments might make this year's halving not quite as dramatic, but more of a slow and steady burn. Still, I believe the days of $3,000 to $6,000 BTC are a thing of the past. We are entering a new era." says Robert Beadles.
Bullish momentum is set to take the pair higher to test next major resistance at 11,026 (61.8% Fib). Minor corrections on account of overbought oscillators cannot be ruled out. Supports on the downside align at 10102 (5-DMA), 9485 (21-EMA) and 8864 (200-DMA). Retrace below 200-DMA will see a change in near-term dynamics.


