


 FxWirePro- Major Crypto levels and bias summary
  NZDJPY Bullish Surge: Strong Kiwi Ignites Fresh Upside as 94 Support Holds and All EMAs Align
  EUR/USD Holds Bullish Tone Despite Pullback from Yesterday’s High
  GBPJPY Bullish Surge: Strong Pound Ignites Fresh Upside on Fed-BOE Policy Divergence as All EMAs Align
  Major Pair Action Bias: Extremely Bullish Surge Powers GBPUSD & NZDUSD as Bullish Momentum Ignites
  GBPJPY Bullish on Consolidation: Holds Above 216 After 218 Top – Buy Dips at 217 Targeting 220
  Crypto Major Pair Action Bias: ETHUSD Bullish as BTCUSD, SOLUSD & XRPUSD Stay Neutral
  FxWirePro- Major Crypto levels and bias summary


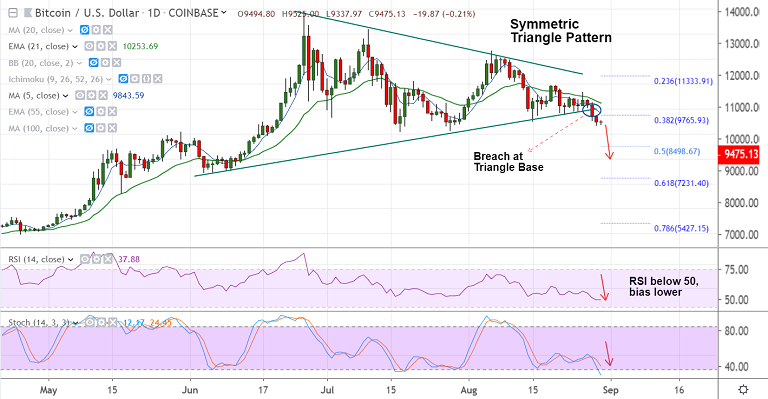
BTC/USD chart - Trading View
Exchange - Coinbase
Support: 8966 (21W EMA); Resistance: 9846 (5-DMA)
Technical Analysis: Bias Bearish
BTC/USD trades in a narrow range, largely muted at 9481 at 05:15 GMT.
The pair has hit 4-week lows at 9321 on Thursday's trade, bias remains bearish.
Technical indicators suggest weakness for the pair. Stochs and RSI are sharply lower.
MACD and ADX support downtrend. 'Symmetric Triangle' breach keeps bearish pressure.
That said, volatility is low on the intraday charts. Oscillators are at oversold levels which could see some pullback.
110-EMA (9522) is immediate resistance. Break above could see test of 5-DMA at 5845. Breakout at 50-DMA required for upside continuation.
Resumption of weakness will see test of 9108 (July 28 low).


