


 GBPJPY Bullish Surge: Strong Pound Ignites Fresh Upside on Fed-BOE Policy Divergence as All EMAs Align
  JPY Action Bias: Extremely Bullish Surge Ignites Across NZD, GBP & AUD
  FxWirePro- Major Crypto levels and bias summary
  FxWirePro- Woodies pivot (Major)
  AUDJPY Bullish Surge: Strong Australian Dollar Fuels Fresh Upside as Pair Holds Above 113.50 and All EMAs Align
  FxWirePro: AUD/USD remains buoyant, looks to extend gains
  FxWirePro: NZD/USD steadies around 0.5830,retains bid tone
  FxWirePro- Major Crypto levels and bias summary


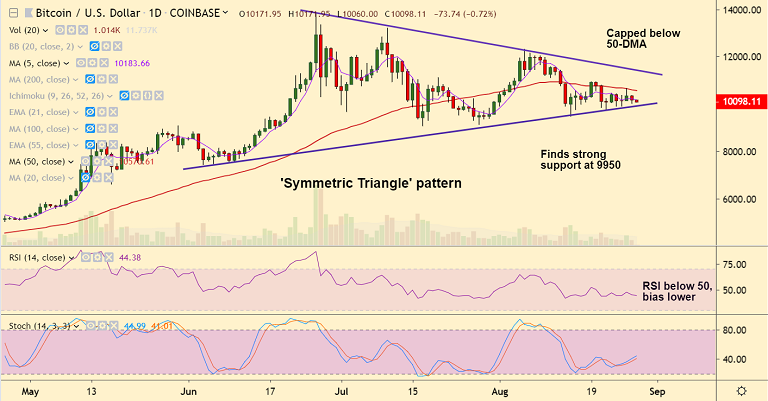
BTC/USD chart - Trading View
Exchange - Coinbase
Support: 9950 (Trendline); Resistance: 10570 (50-DMA)
Technical Analysis: Bias slightly bearish
BTC/USD is trading in a narrow range, down 0.74% on the day at 10,096 at 04:45 GMT.
Price action is capped below 5-DMA and daily cloud, bias is slightly bearish.
The pair trades in a 'Symmetric Triangle' pattern, finds strong support at 9950 (Triangle base).
Technical indicators are slightly bearish. Volatility is rising on the intraday charts.
Breach at 'Triangle base' will plummet prices. Scope then for test of 110-EMA at 9530.
On the flipside, 5-DMA is immediate resistance at 10375. Breakout above cloud negates bearish bias.


