


 Crypto Major Pair Action Bias: ETHUSD Bullish as BTCUSD, SOLUSD & XRPUSD Stay Neutral
  FxWirePro:EUR/NZD dips below lower range, bearish bias increases
  ETH Stands Alone Bullish; BTC, SOL, XRP, BNB Neutral
  AUDJPY Bullish Surge: Strong Australian Dollar Fuels Fresh Upside as Pair Holds Above 113.50 and All EMAs Align
  NZDJPY Extremely Bullish Above 94: Broad NZD Buying Fuels Fresh Upside – Buy Dips at 93.70 Targeting 95
  FxWirePro- Major Crypto levels and bias summary
  FxWirePro- Major Crypto levels and bias summary
  FxWirePro: USD/CAD falls after BoC rate hold and weak U.S. producer inflation
  BTCUSD Bullish Breakout: Clears 800-EMA After Consolidation, Buy Dips Toward $74,900


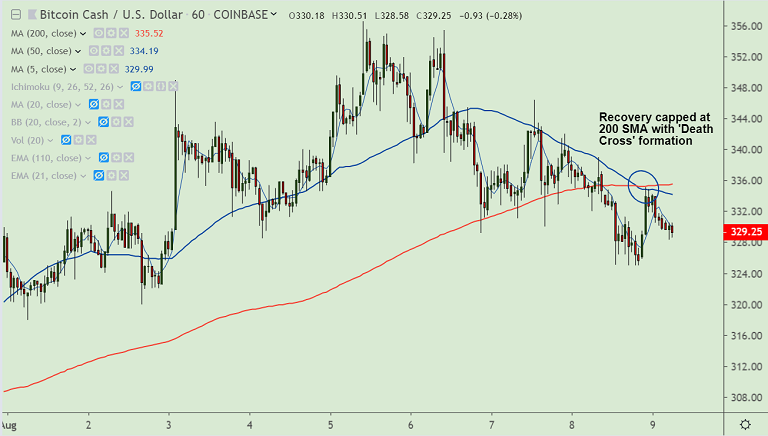
BCH/USD chart - Trading View
Exchange - Coinbase
Support: 321.58 (20-DMA); Resistance: 348.27 (55-EMA)
Technical Analysis: Bias turning bearish
Bitcoin Cash is slipping below 21-EMA, raising scope for further weakness.
Technical indicators are turning slightly bearish on the daily charts.
RSI has fallen below 50 mark and Stochs are showing a reversal from overbought levels.
Recovery was capped below 200H SMA on the hourly charts. A 'Death Cross' formation adds to the bearish bias.
Immediate support is seen at 20-DMA at 321.53. Break below eyes 200-DMA at 277.28.
On the flipside, 55-EMA is major resistance. Breakout negates bearish bias.


