


 BTCUSD Bullish Breakout: Clears 800-EMA After Consolidation, Buy Dips Toward $74,900
  FxWirePro- Major Crypto levels and bias summary
  FxWirePro: AUD/USD edges lower, but bullish outlook persists
  FxWirePro: EUR/AUD outlook weaker on renewed downside pressure
  FxWirePro :USD/JPY bulls loosen their grip a bit, dips to be bought
  FxWirePro: USD/JPY uptrend loses steam, remains on bullish path
  FxWirePro: NZD/USD trades in narrow range ,outlook bullish
  EUR/USD Holds Bullish Tone Despite Pullback from Yesterday’s High
  FxWirePro- Major Pair levels and bias summary


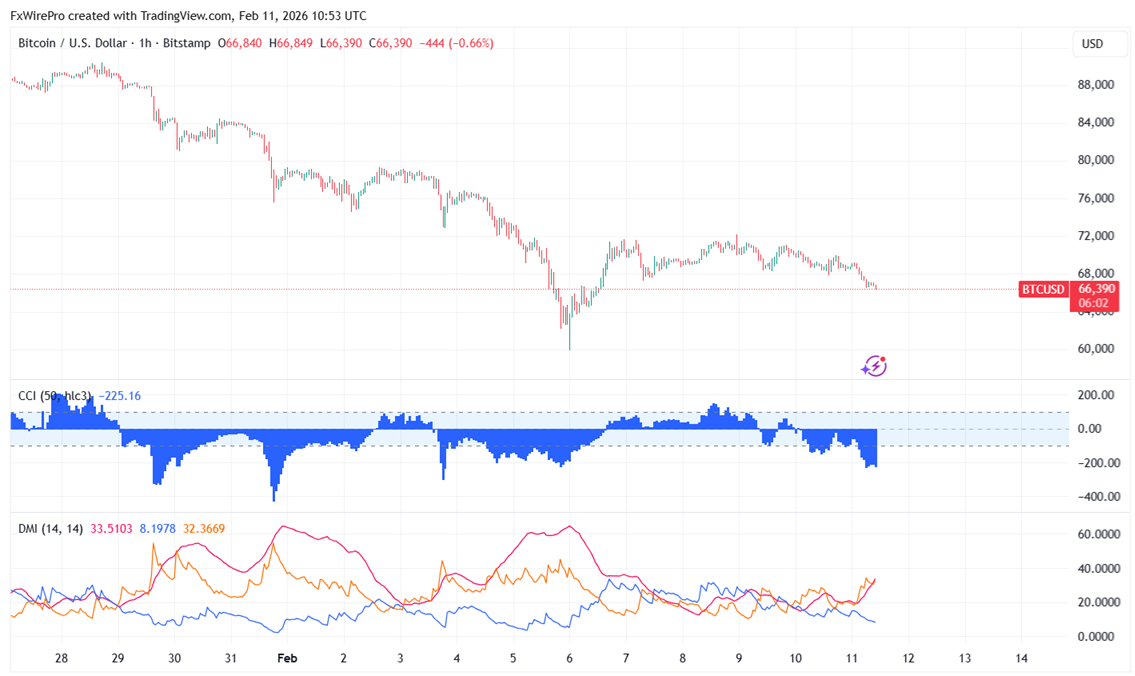
BTCUSD trades weak after minor pullback above $70000. It hits an intraday low of $66509 and is currently trading around $66629
|
Technicals |
CMP -$66629 |
Trend |
|
|
1- Hour chart |
Value |
|
|
|
55 EMA |
$68913 |
CMP is less than 55 EMA |
Bearish |
|
200- EMA |
$71518 |
CMP is less than 2200- EMA |
Bearish |
|
365- EMA |
$75253 |
CMP more than value |
Bullish |
In the 4- hour chart, the pair is trading well below short term - $72011 (55-EMA) and long-term- $85589 (365- EMA) and $81163 (200-EMA).
Major support- $64000/$60000/$52500/$50000. Minor bullishness only above $72500.
|
Momentum indicator (1-hour chart) |
Inference |
Value |
|
CCI(50) |
below zero line (bearish) |
-208 |
|
ADX |
Bearish |
Strength - 33 (bearish trend) |
It is good to sell on rallies around $70000 with SL around $72500 for a TP of $60000.


