


 State of emergency in Crimea as Ukraine focuses pressure on ‘jewel in Putin’s crown’
  USA at 250: the Black American struggle for life, liberty and the pursuit of happiness
  JPMorgan Cuts Gold Price Forecast, Sees Bullion Reaching $4,500 by End of 2026
  Smartphones are helping filmmakers tell the stories the movie industry overlooks
  Goldman Sachs Says China Competition Weighs More on EU Growth Than Trade Deficit
  Alcohol is one of the most dangerous drugs, yet its presence is ubiquitous in social settings and celebrations
  Gold Surges Past $4150 on Dovish Fed Signals and Weak Jobs Data; Bullish Outlook Prevails


 - EconoTimes)


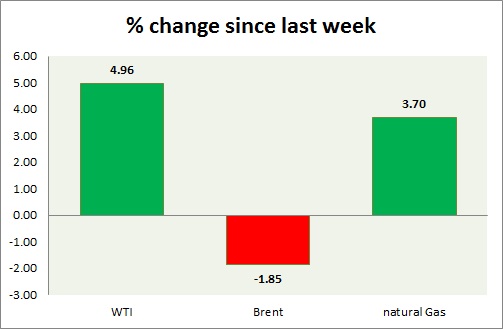
The energy segment over the last year remained the worst performer. Performance this week at a glance in chart & table -
- Oil (WTI) - Crude oil continue to trade between short ranges unimpressed by the comments of FED chair Janet Yellen so far. Dollar was weak across board, but crude turned out to be even weaker. Today's inventory data to be released at 15:30 GMT. Focus will be on total stocks as well as change in rigs in response to lower price. WTI is currently trading at $49.1/ barrel, down 0.25% for the day. Immediate support lies at 48 and resistance at 54.
- Oil (Brent) - WTI remains the worst performer in the segment. Brent-WTI spread is doing worse than yesterday trying to close above $10. Brent is currently trading at $59.1/barrel, up 0.99% for the day. Immediate support lies at 58 & resistance at 63.
- Natural Gas - Natural gas price is lacking volatility which could change in tomorrow's inventory report. Natural gas is currently trading at $ 2.92/mmbtu. Immediate support lies at 2.77 & resistance at 3.03.
|
WTI |
-3.35% |
|
Brent |
-1.55% |
|
Natural Gas |
-1.08% |


