


 In a rebuke to Trump, the Supreme Court rules that birthright citizenship is the law of the land
  Michael Burry Shorts Tesla at $416 as AI and Semiconductor Bearish Bets Expand
  State of emergency in Crimea as Ukraine focuses pressure on ‘jewel in Putin’s crown’
  Trump has made more than $1 billion from crypto in a year. How?
  Bernstein Names IAG, Ryanair as Top European Airline Stocks Ahead of Earnings
  USA at 250: the Black American struggle for life, liberty and the pursuit of happiness
  Buy the Dip: Gold Holds Strong at $3980, Targets $4150
  AI can be a personal trainer in your pocket – but is it safe?
  Gold Surges Past $4150 on Dovish Fed Signals and Weak Jobs Data; Bullish Outlook Prevails
  Goldman Sachs Says China Competition Weighs More on EU Growth Than Trade Deficit
  Elon Musk is remaking the world, like Henry Ford before him – but more dangerously
  JPMorgan Cuts Gold Price Forecast, Sees Bullion Reaching $4,500 by End of 2026


 - EconoTimes)


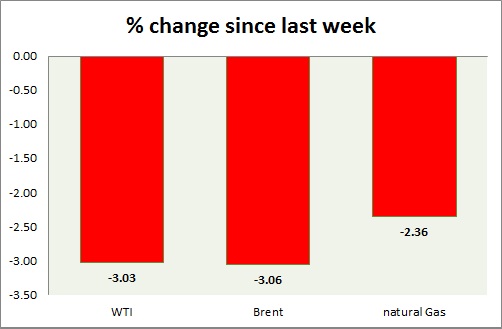
Energy pack is in red today. Weekly performance at a glance in chart & table.
Oil (WTI) -
- WTI failed attempt to gain soured as stocks rose at fastest pace since April. Today's range $46.3-43.7
- Stocks in US rose by 4.67 million barrels according to EIA and 7.6 million barrels according to API.
- WTI is currently trading at $43.9/barrel. Immediate support lies at $43.3, $41.5 area and resistance at $50 area.
Oil (Brent) -
- Brent dropped along with WTI, however relatively better performer than today. However that part soured after EIA data. Today's range - $48.3-50.8.
- Brent-WTI flat at $4.5/barrel. Further contraction possible.
- Brent is trading at $48.5/barrel. Immediate support lies at $48 area and resistance at $54.5, 59 region.
Natural Gas -
- Natural gas continues to consolidate around $2.7/mmbtu and likely to drop further, focus on inventory tomorrow. Today's range $2.70-2.645.
- Price might drop to $2.35/mmbtu, since support cleared. However $2.63 area proving to be strong support.
- Natural Gas is currently trading at $2.65/mmbtu. Immediate support lies at $2.55, $2.45 area & resistance at $2.75, $2.95, $3.04, $3.32.
WTI
+2.05%
Brent
+1.54%
Natural Gas
-1.25%


