


 Trump has made more than $1 billion from crypto in a year. How?
  JPMorgan Cuts Gold Price Forecast, Sees Bullion Reaching $4,500 by End of 2026
  Smartphones are helping filmmakers tell the stories the movie industry overlooks
  Goldman Sachs Raises USD/JPY Forecast, Sees Yen Weakness Persist Through 2027
  Vietnam’s population hit the 100 million milestone. Where’s it headed?
  Gold Pulls Back After Hitting $4,180 as Geopolitical Risk Sends Crude Higher
  Bank of America Upgrades T-Mobile to Buy, Says LEO Satellite Fears Are Overdone
  USA at 250: the Black American struggle for life, liberty and the pursuit of happiness
  In a rebuke to Trump, the Supreme Court rules that birthright citizenship is the law of the land
  Citi Raises TSMC Price Target as AI Chip Demand Strengthens Growth Outlook
  Bernstein Names IAG, Ryanair as Top European Airline Stocks Ahead of Earnings
  Buy the Dip: Gold Holds Strong at $3980, Targets $4150


 - EconoTimes)


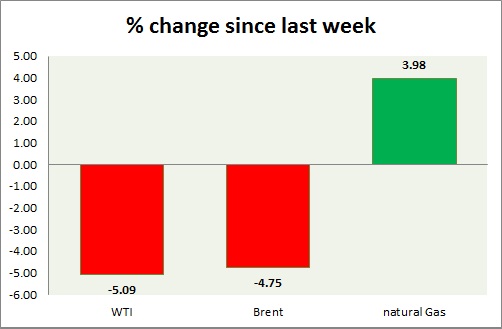
Energy pack is mixed, while oil is down, gas is up. Weekly performance at a glance in chart & table.
Oil (WTI) -
- WTI dropped further today as $45 support was taken out yesterday. Today's range $45.3-44.2
- WTI is likely to fall towards $42 area. The drop might extend below $40 area.
- WTI is currently trading at $44.4/barrel. Immediate support lies at $42 and resistance at $54
Oil (Brent) -
- Brent is a better performer than WTI. Today's range - $48.9-49.9.
- Brent-WTI spread rose by 70 cents since last trading day, currently trading at $4.9/barrel.
- $50 area is posing as resistance.
- Brent is trading at $49.3/barrel. Immediate support lies at $45 area and resistance at $53 region.
Natural Gas -
- Natural trading in positive after finding support around $2.7 area once more. Today's range $2.84-2.72.
- Price might reach as low as $2.35 if it clears $2.7 mark, whereas bulls might try to test $2.95 area.
- Focus is on FOMC on tomorrow.
- Inventory rose by 32 billion cubic feet this week.
- Natural Gas is currently trading at $2.82/mmbtu. Immediate support lies at $2.55, $2.45 area & resistance at $2.95, $3.04, $3.32.
|
WTI |
-5.09% |
|
Brent |
-4.75% |
|
Natural Gas |
+3.98% |


