


 In a rebuke to Trump, the Supreme Court rules that birthright citizenship is the law of the land
  JPMorgan Cuts Gold Price Forecast, Sees Bullion Reaching $4,500 by End of 2026
  State of emergency in Crimea as Ukraine focuses pressure on ‘jewel in Putin’s crown’
  Bernstein Names IAG, Ryanair as Top European Airline Stocks Ahead of Earnings
  Goldman Sachs Says China Competition Weighs More on EU Growth Than Trade Deficit
  USA at 250: the Black American struggle for life, liberty and the pursuit of happiness
  Trump has made more than $1 billion from crypto in a year. How?
  Bank of America Upgrades T-Mobile to Buy, Says LEO Satellite Fears Are Overdone
  Gold Surges Past $4150 on Dovish Fed Signals and Weak Jobs Data; Bullish Outlook Prevails
  Gold Pulls Back After Hitting $4,180 as Geopolitical Risk Sends Crude Higher
  Citi Raises TSMC Price Target as AI Chip Demand Strengthens Growth Outlook


 - EconoTimes)


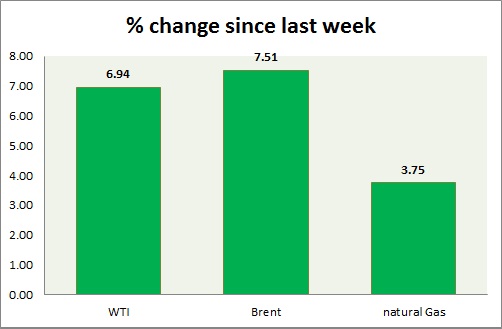
Energy segment gave up all most of the gains in today's trading. Weekly performance at a glance in chart & table -
- Oil (WTI) - WTI selloffs continued today after brief pause over FOMC and weak dollar. WTI traded as high as WTI is currently trading at $43.5/ barrel, down nearly 2.5% today. Immediate support lies at 42, 38 and resistance at 45.5, 48.3.
- Oil (Brent) - Brent performance is similar to WTI but mild better. Brent-WTI spread is trading at $ 11.36, support lies at $8 and resistance at $13. Brent has reached the initial target of $53. Might wail for further direction. Brent is trading at $54.83/barrel. Immediate support lies at 53, 50, 47 & resistance at 56, 58.4.
- Natural Gas - Natural gas is trading directionless. It broke above the initial resistance after FOMC but gave up the gain in today's trading. Today's inventory report failed to provide further direction. Inventory 45 billion cubic feet. Natural Gas is currently trading at 2.82/mmbtu. Immediate support lies at 2.65 & resistance at 2.87, 3.02.
|
WTI |
-3.18% |
|
Brent |
0.73% |
|
Natural Gas |
3.68% |


