


 Gold Surges Past $4150 on Dovish Fed Signals and Weak Jobs Data; Bullish Outlook Prevails
  Goldman AM Sees Strong Buyout Opportunities in Japan, South Korea and Australia
  In a rebuke to Trump, the Supreme Court rules that birthright citizenship is the law of the land
  USA at 250: the Black American struggle for life, liberty and the pursuit of happiness
  Vietnam’s population hit the 100 million milestone. Where’s it headed?
  Gold Pulls Back After Hitting $4,180 as Geopolitical Risk Sends Crude Higher
  Trump has made more than $1 billion from crypto in a year. How?


 - EconoTimes)


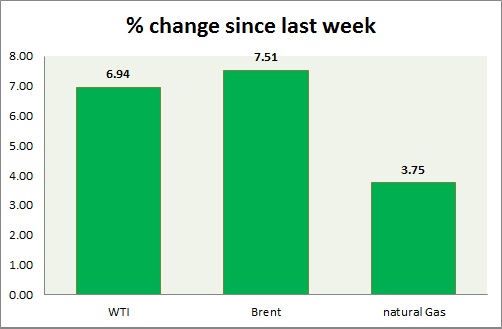
Energy performance is mixed in today's trading. Weekly performance at a glance in chart & table -
- Oil (WTI) - WTI selloffs continued as expected after key support level got broken. WTI has reached initial target of $42.5/ barrel. Today is sixth consecutive decline. WTI is currently trading at $43/ barrel, down nearly 2% today. Immediate support lies at 42 and resistance at 48.3.
- Oil (Brent) - Brent continued fall as concerns rise over new exports from Iran. Brent-WTI spread is trading at $ 9.6, support lies at $8 and resistance at $13. Brent has reached the initial target of $53. Price continued fall due to momentum but might remain capped as FOMC looms ahead. Brent is trading at $52.64/barrel. Immediate support lies at 53.2 & resistance at 58.4.
- Natural Gas - Natural gas bounced from support as prospect of an inventory crunch rose. Companies installing more natural gas capacity to generate electricity is leading to the crunch with addition of colder temperature. Last week inventory fell below 5 year average. Natural Gas is currently trading at 2.79/mmbtu. Price range is squeezing, there might be breakout ahead. Immediate support lies at 2.65 & resistance at 2.87.
|
WTI |
-4.25% |
|
Brent |
-2.99% |
|
Natural Gas |
3.31% |


