


 Citi Raises TSMC Price Target as AI Chip Demand Strengthens Growth Outlook
  Smartphones are helping filmmakers tell the stories the movie industry overlooks
  Vietnam’s population hit the 100 million milestone. Where’s it headed?
  USA at 250: the Black American struggle for life, liberty and the pursuit of happiness
  Gold Surges Past $4150 on Dovish Fed Signals and Weak Jobs Data; Bullish Outlook Prevails
  Bank of America Upgrades T-Mobile to Buy, Says LEO Satellite Fears Are Overdone
  Goldman Sachs Says China Competition Weighs More on EU Growth Than Trade Deficit
  Goldman Sachs Raises USD/JPY Forecast, Sees Yen Weakness Persist Through 2027
  Goldman AM Sees Strong Buyout Opportunities in Japan, South Korea and Australia
  Alcohol is one of the most dangerous drugs, yet its presence is ubiquitous in social settings and celebrations
  Trump has made more than $1 billion from crypto in a year. How?
  In a rebuke to Trump, the Supreme Court rules that birthright citizenship is the law of the land


 - EconoTimes)


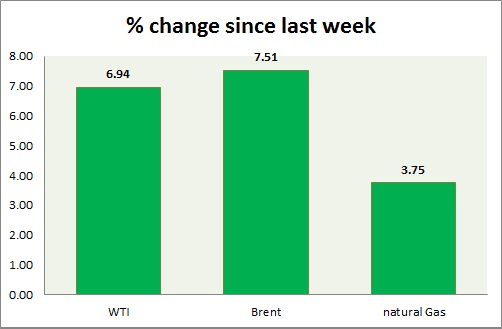
Energy as an asset class is the worst performer in today's trading and this week's. Weekly performance at a glance in chart & table -
- Oil (WTI) - WTI selloffs accelerated as expected after key support level got broken. WTI is yet to reach initial target of $42/ barrel. WTI is currently trading at $45.20/ barrel, down nearly 4% today. Immediate support lies at 42 and resistance at 48.3.
- Oil (Brent) - Brent fell in today's trading but gained over the spreads. Brent-WTI spread is trading at $ 10.7, support lies at $8 and resistance at $13. Price pattern suggests a move towards $ 53/barrel is likely as key support at 58 was broken. Brent is trading at $56.09/barrel. Immediate support lies at 53.2 & resistance at 58.4.
- Natural Gas - Natural gas prices fell as inventory shrinkage was lower than previous, however inventory fell below 5 year average. Natural Gas is currently trading at 2.69/mmbtu. Price range is squeezing, there might be breakout ahead. Immediate support lies at 2.65 & resistance at 2.87.
|
WTI |
-8.67% |
|
Brent |
-5.95% |
|
Natural Gas |
-5.28% |


