


 JPMorgan Cuts Gold Price Forecast, Sees Bullion Reaching $4,500 by End of 2026
  Goldman AM Sees Strong Buyout Opportunities in Japan, South Korea and Australia
  USA at 250: the Black American struggle for life, liberty and the pursuit of happiness
  Goldman Sachs Says China Competition Weighs More on EU Growth Than Trade Deficit
  Bank of America Upgrades T-Mobile to Buy, Says LEO Satellite Fears Are Overdone
  State of emergency in Crimea as Ukraine focuses pressure on ‘jewel in Putin’s crown’
  Bernstein Names IAG, Ryanair as Top European Airline Stocks Ahead of Earnings
  Smartphones are helping filmmakers tell the stories the movie industry overlooks
  Gold Surges Past $4150 on Dovish Fed Signals and Weak Jobs Data; Bullish Outlook Prevails
  Alcohol is one of the most dangerous drugs, yet its presence is ubiquitous in social settings and celebrations


 - EconoTimes)


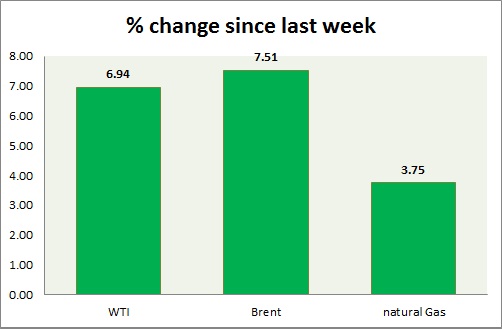
Selloffs continue in Energy segment as a whole though performance is diverging in today's trading. Weekly performance at a glance in chart & table -
- Oil (WTI) - WTI lost grounds after inventory report from EIA showed further gains in storage by 4.512 million barrels. WTI may lose further ground as key support got broken. Selloffs might push the price as low as $42/barrel. WTI is currently trading at $47.7/ barrel. Immediate support lies at 47, 42 and resistance at 49.2.
- Oil (Brent) - Supply concerns over Middle East continues to weigh on price. However Brent recovered some grounds especially against spreads in today's trading. Brent-WTI spread is trading at $ 9.5, after reaching below $8 this week. Price pattern suggests a move towards $ 53/barrel is likely as key support at 58 was broken. Brent is trading at $56.5/barrel. Immediate support lies at 53.2 & resistance at 59.
- Natural Gas - Natural gas, top gainer in today's trading as information suggests inventory tomorrow might fall more than expected. Natural Gas is currently trading at 2.83/mmbtu. Price range is squeezing, there might be breakout ahead. Immediate support lies at 2.65 & resistance at 2.87.
|
WTI |
-4.04% |
|
Brent |
-4.19% |
|
Natural Gas |
-0.70% |


