


 UBS Projects Mixed Market Outlook for 2025 Amid Trump Policy Uncertainty
  Global Markets React to Strong U.S. Jobs Data and Rising Yields
  Moldova Criticizes Russia Amid Transdniestria Energy Crisis
  Gold Prices Fall Amid Rate Jitters; Copper Steady as China Stimulus Eyed
  FxWirePro- Major Crypto levels and bias summary
  Indonesia Surprises Markets with Interest Rate Cut Amid Currency Pressure
  ETHUSD Bullish Momentum: Follows BTC Above All EMAs, Buy Dips Near $1750 Targeting $2300
  U.S. Banks Report Strong Q4 Profits Amid Investment Banking Surge
  Mexico's Undervalued Equity Market Offers Long-Term Investment Potential
  Gold Prices Slide as Rate Cut Prospects Diminish; Copper Gains on China Stimulus Hopes
  Bank of America Posts Strong Q4 2024 Results, Shares Rise


We wouldn’t run you through on the boredom news that booms across the cryptocurrency gamut which is universally known. Yes, we meant constant steep slumps in the cryptocurrency prices.
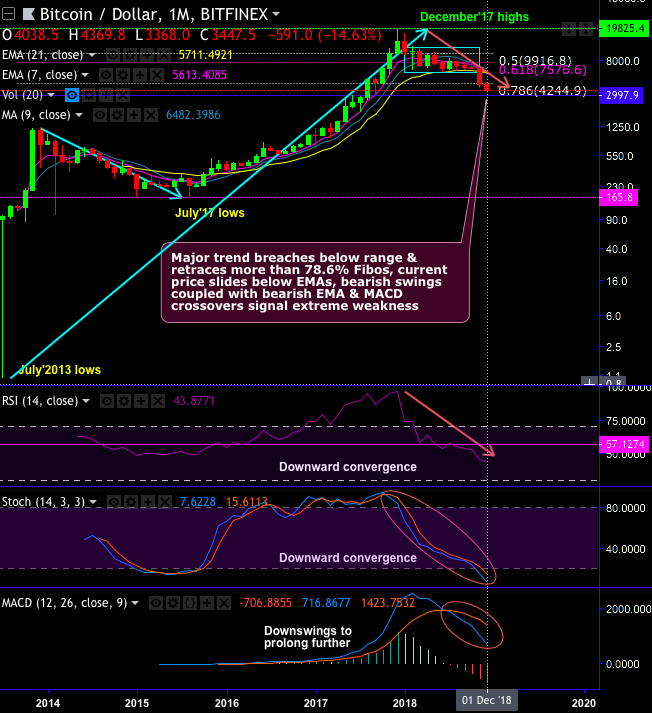
Bitcoin and its peers have again resumed their bearish streaks, sliding further after consolidating briefly above 7-DMAs. The price tumbles below $3,500 mark swiftly, as well as the yearly lows to generate new ones.
Please be noted that the prevailing slumps to a 14-month low during late European session Friday, with crypto markets crashing to their lowest this year today.
But most importantly, over 12 pct of cryptocurrency has been dumped resulting in a USD15 billion plunge to below USD110 billion market capitalization, a new low for the year, as per a report from NewsBTC.
But in contrast, just quickly glance at the sharp rallies from the July 2013 lows of just $1 to the all-time highs of $19,891 levels (i.e. 19,89,000%) which was commendable in just 4-5 years. Such exponential returns can indeed be luring factor for the modern time investor class, isn’t it?
We’ve highlighted the booming cycles in developing stage of the industry in the past as well.
It is explicitly illustrated about this perplexity referring to a concept called “booming cycle” of the price of BTCUSD back in our December 2017 post, please refer below weblink for further reading:
We still, reiterate, it seems that the prevailing bearish swings may create yet another booming cycle.
After referring to the above BTCUSD technical chart, we could foresee some more dips after retracing 78.6% Fibonacci levels in the short-run.
Although bearish sentiment could be owing to test the $3,200 or even $2,997 mark, where the strong support is observed. We wouldn’t be surprised ever if the stronger selling pressure could take it down further to the levels of $2,500-2,750. Hence, investor has to determine his risk appetite and decide whether this asset class is going to be in the dawn or the doomsday.
Currency Strength Index: FxWirePro's hourly BTC spot index has shown -71 (which is bearish), while hourly USD spot index was at -42 (bearish), while articulating at 12:34 GMT. For more details on the index, please refer below weblink:


