


 FxWirePro: Daily Commodity Tracker - 21st March, 2022


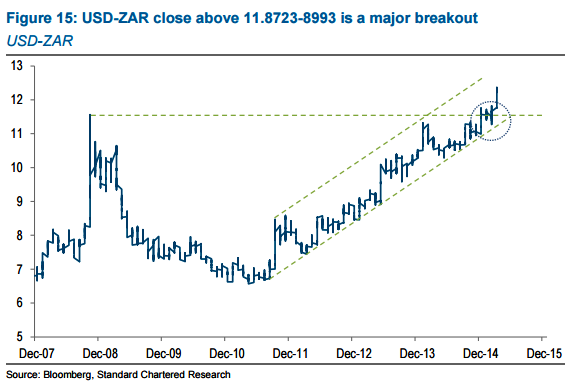
The short- and medium-term trends for USD-ZAR are higher.
The weekly close above the key resistance area at 11.8723-8943 marks a major breakout for USDZAR after a period of consolidation, with 11.8723 marking the 24 October 2008 high and 11.8943 marking the 76.4% Fibonacci retracement of the entire down-move from 13.8401 to 5.5950.
Initial resistance is at the top of the bull channel (in place since the end of March 2012) at around 13.03. However, from the longer-term Fibonacci perspective, the real target is 13.8401 - the record high set on 21 December 2001.
On the daily chart, short-term momentum indicators such as Moving Average Convergence/Divergence,(MACD), Relative Strength Index (RSI) and stochastics remain bullish although RSI appears to be faltering ahead of overbought territory, suggesting some potential for consolidation in the near term at least. On the weekly chart, momentum indicators remain bullish.
Standard Chartered notes....
- USD-ZAR remains firmly within the bull channel, which has been in place since the start of the DXY rally in mid-2011. The weekly MACD 'buy' signal continues to dominate the outlook.
- Using the backtesting (BTST) function on Bloomberg, the top three technical strategies year-to-date (Buy and hold, Commodity channel index and Rex oscillator) all show (winning) 'buy' signals. Of the top nine technical strategies YTD, seven show 'buy' signals.
- The top strategy - Buy and hold - has a Sharpe ratio of 3.53.


